
Here are the latest updates, features, and announcements to help you master your trading edge.
April 6, 2026
Welcome to the biggest update in Trade Licks history. We have completely transformed the platform from a journaling tool into a comprehensive ecosystem for building, testing, and scaling your trading edge. Here are just a few of the key highlights from this update:
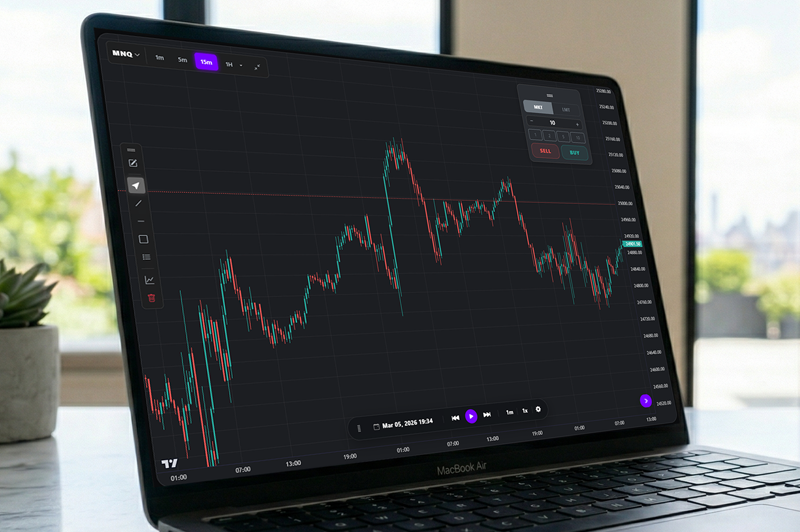
Stop risking live capital to test new ideas. Fully integrated backtesting with three distinct ways to play.
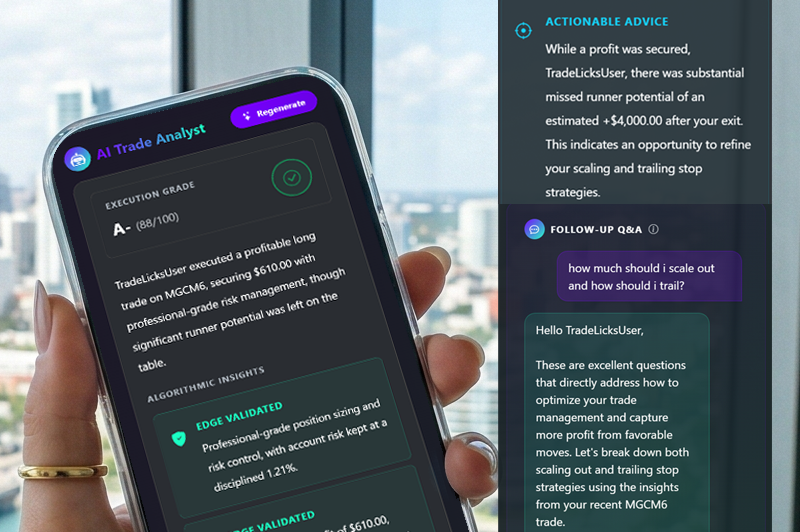
An institutional-grade risk manager analyzing your move 24/7.
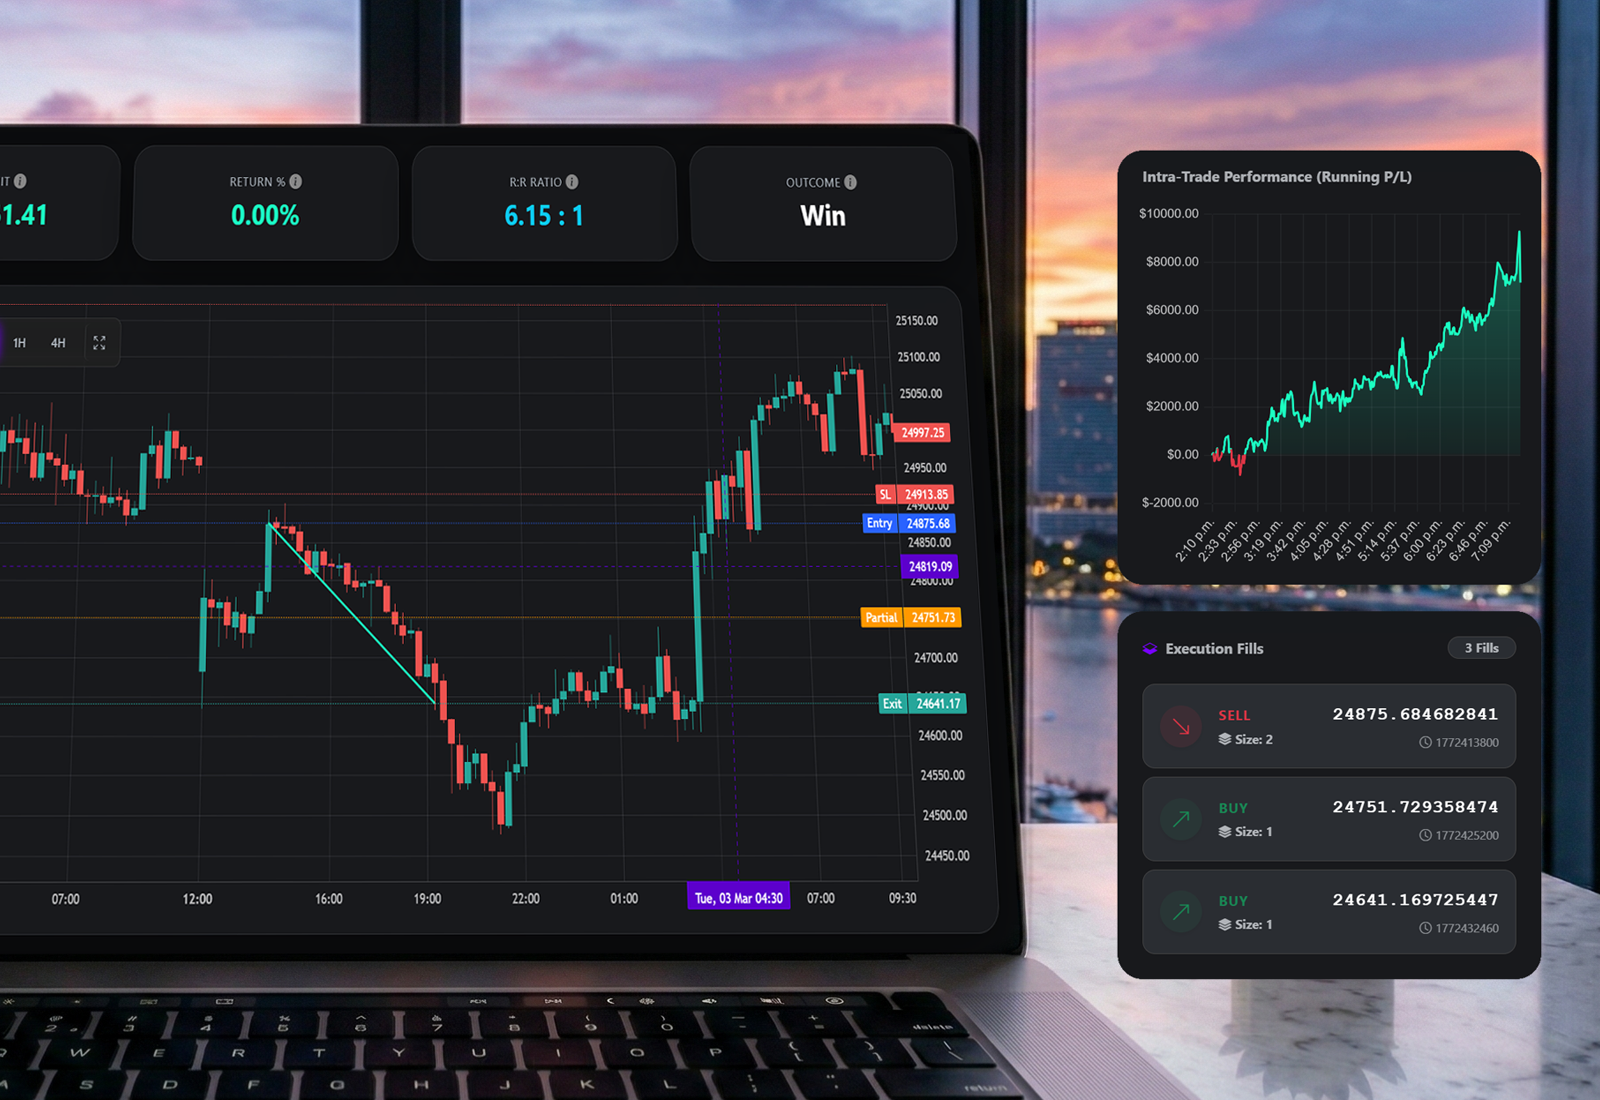
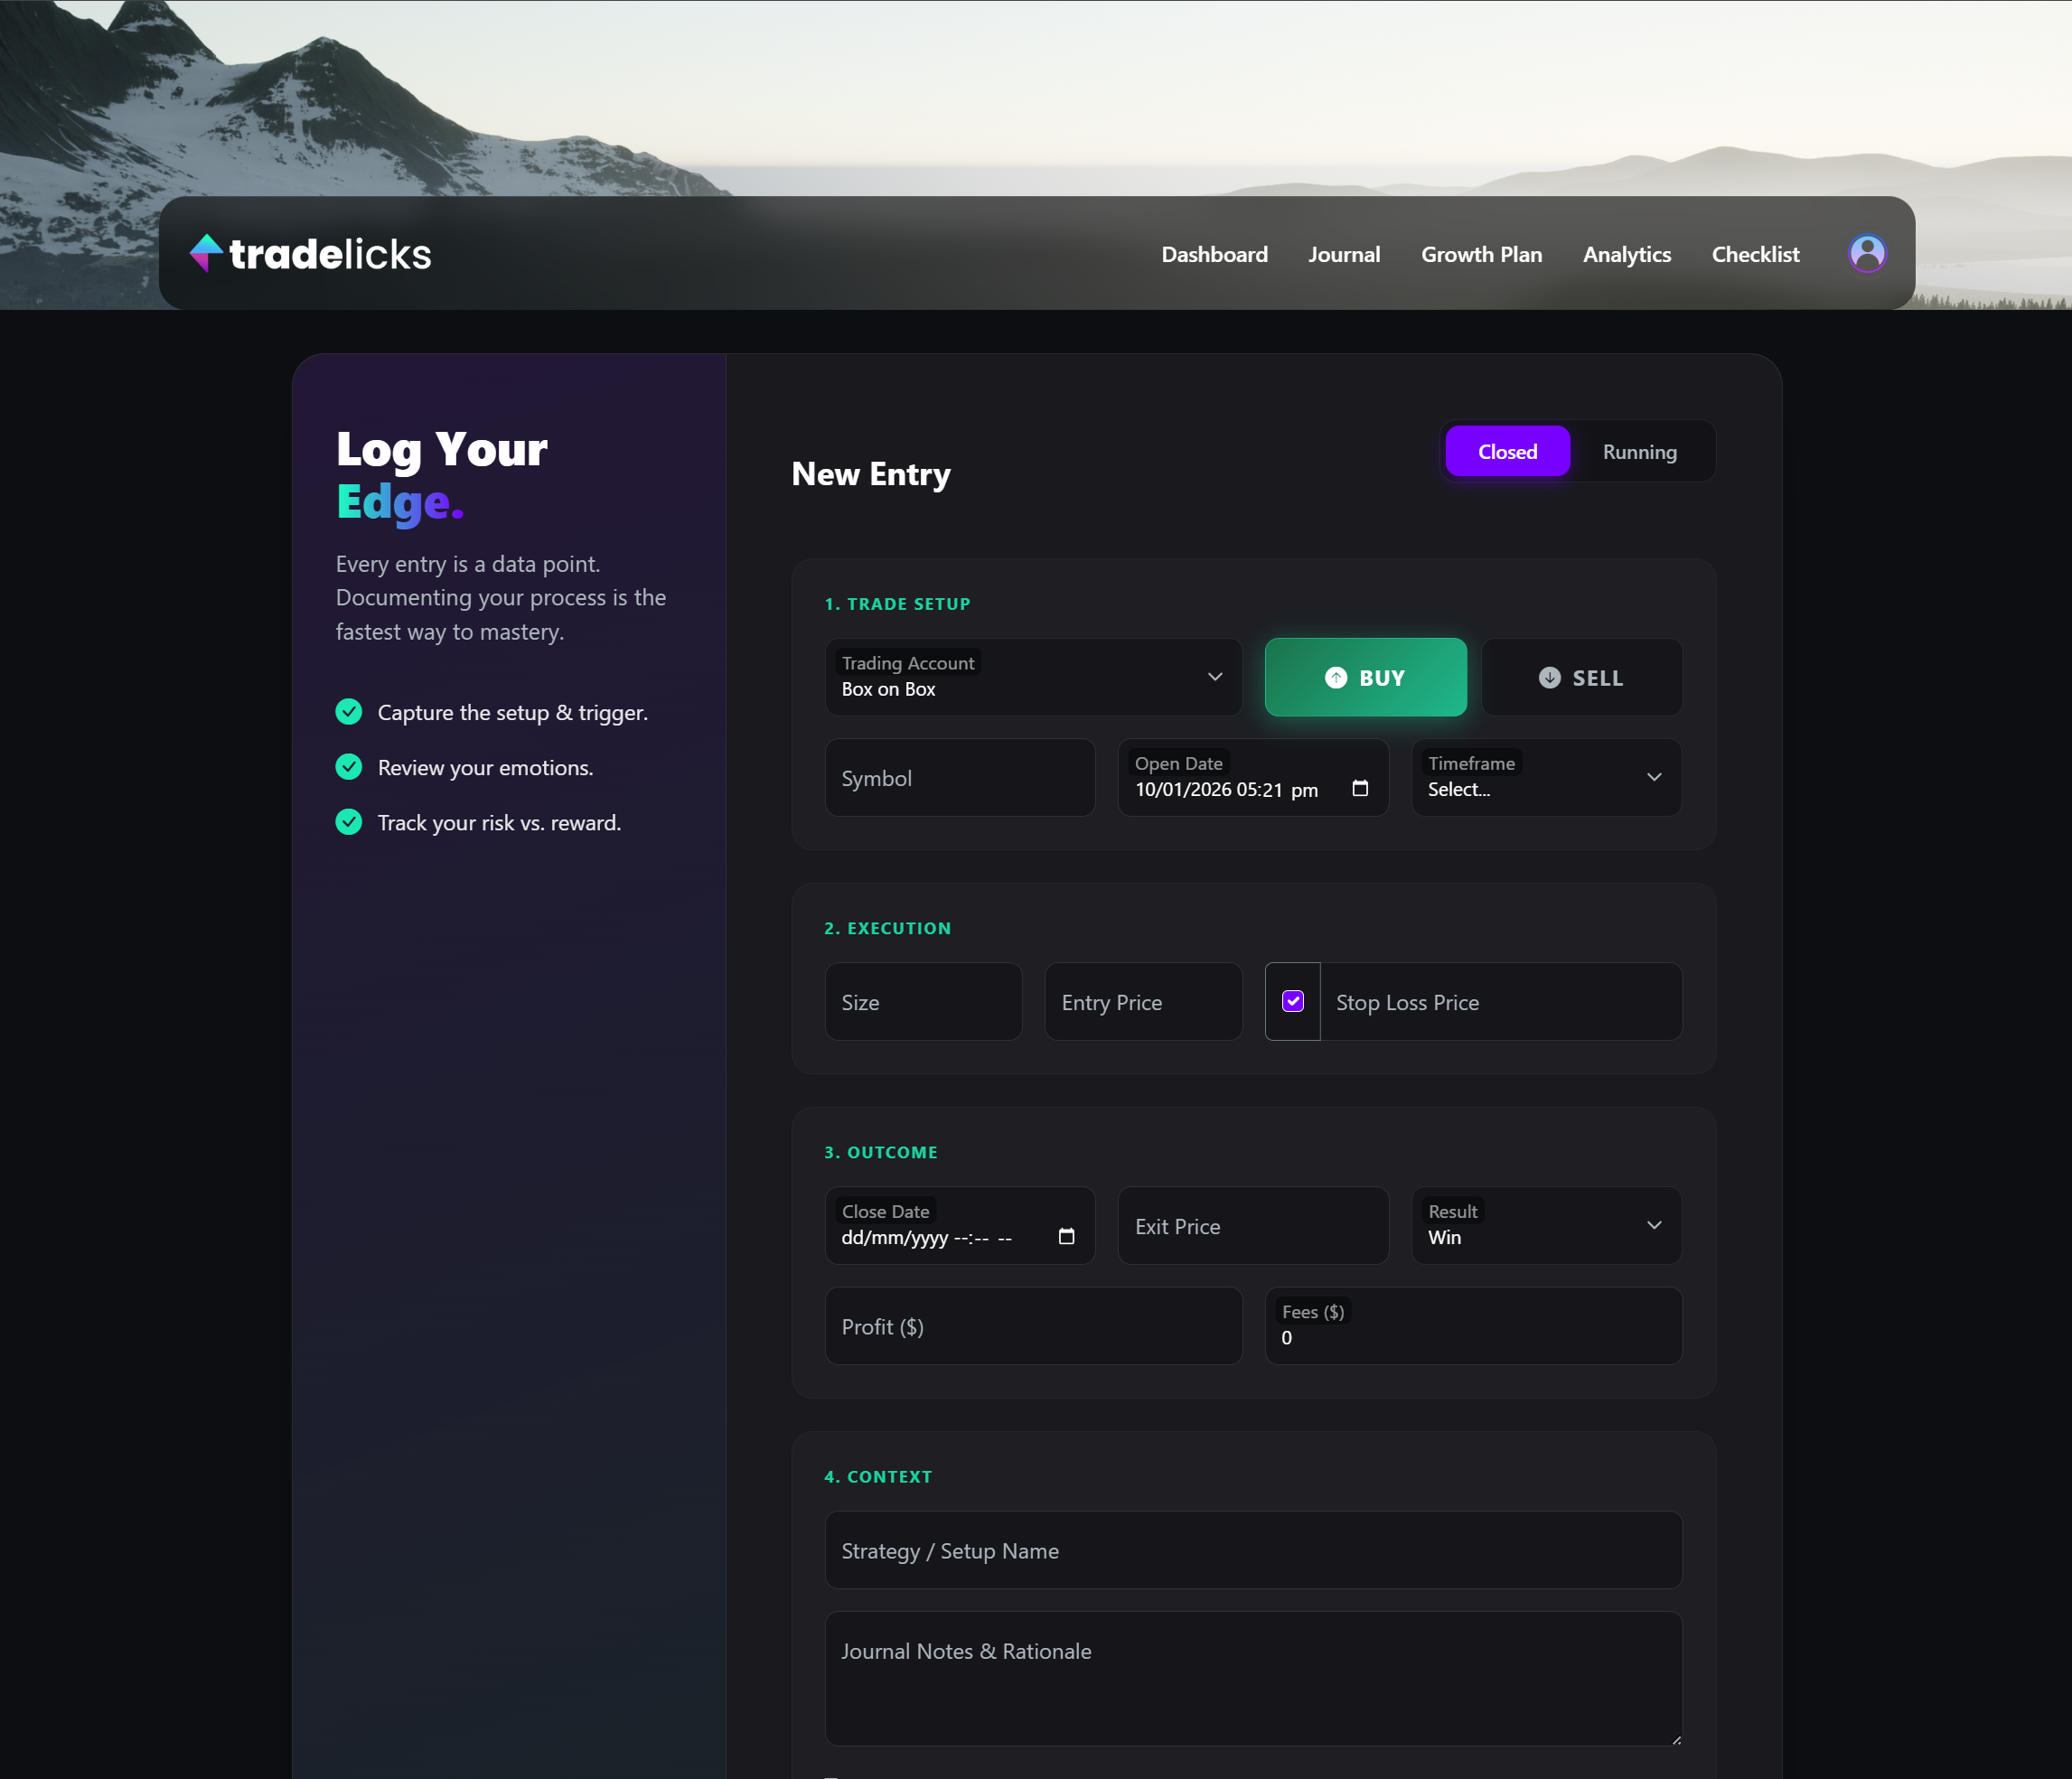
Rewrite of our core math engine for professional-grade logging.
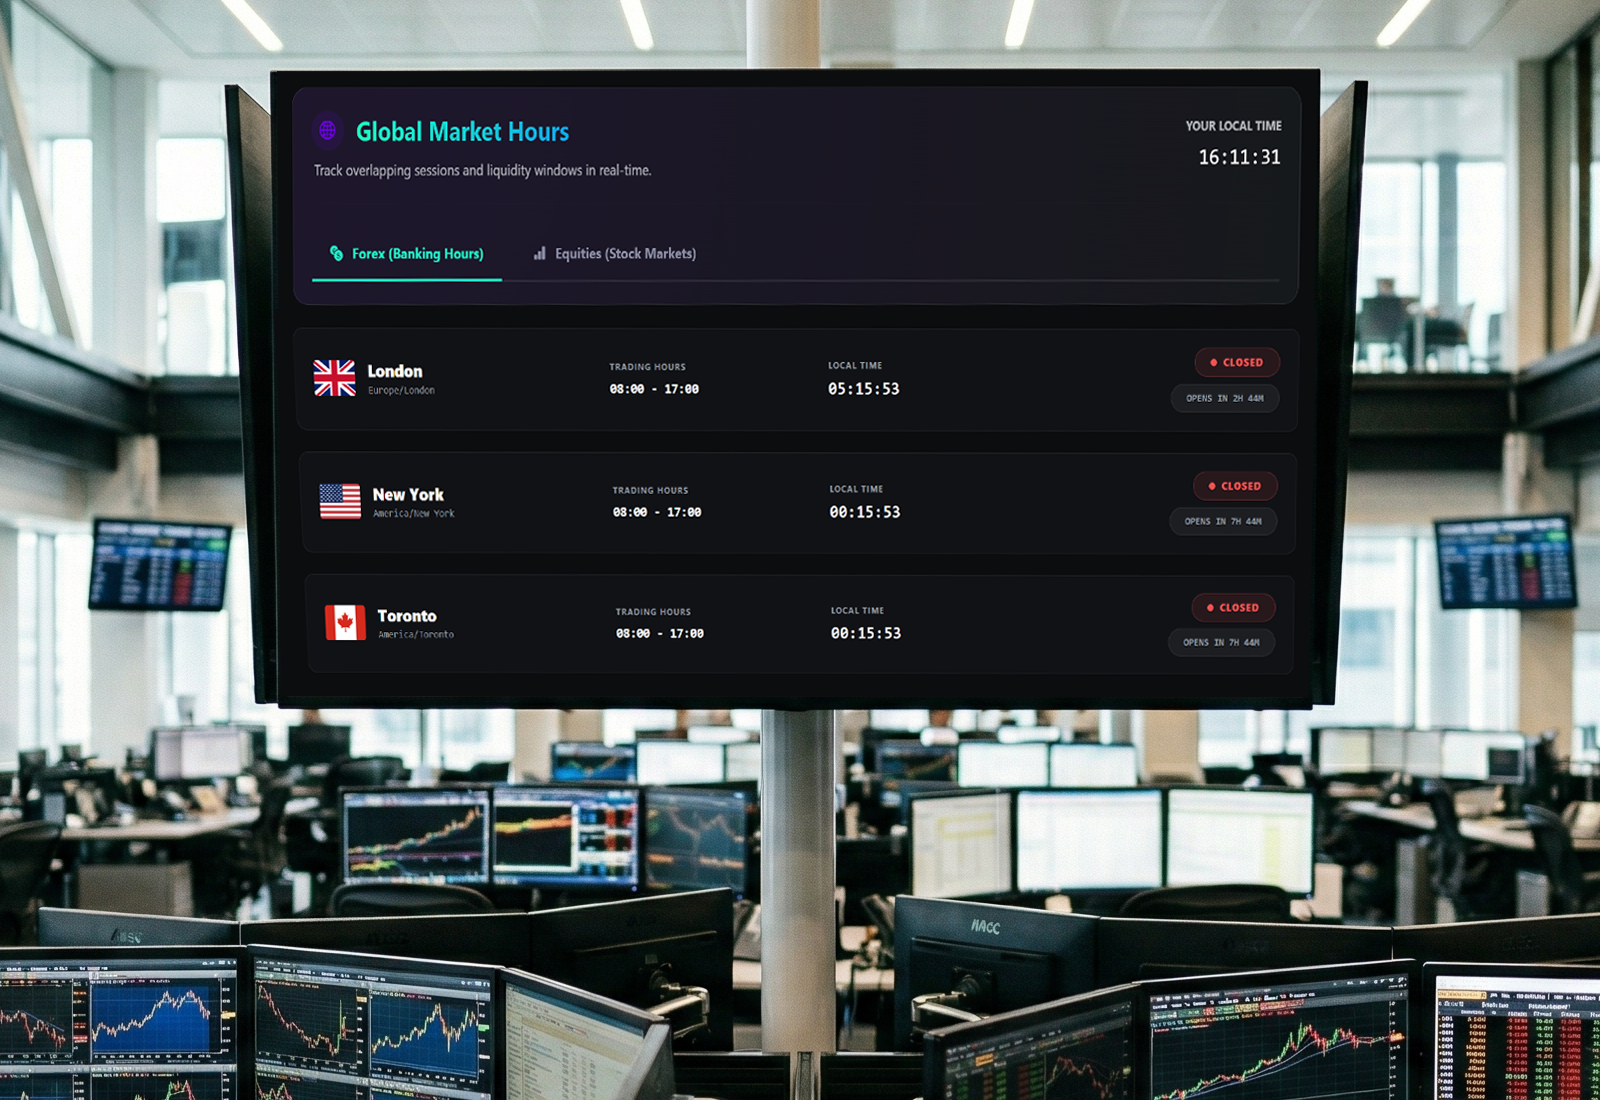
Track live session overlaps and liquidity windows in real-time.
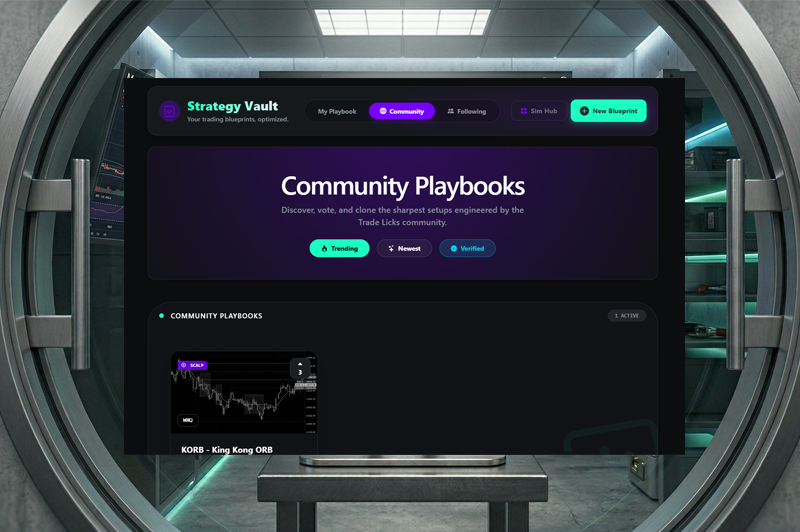
Build your edge and learn from the best traders in the community.
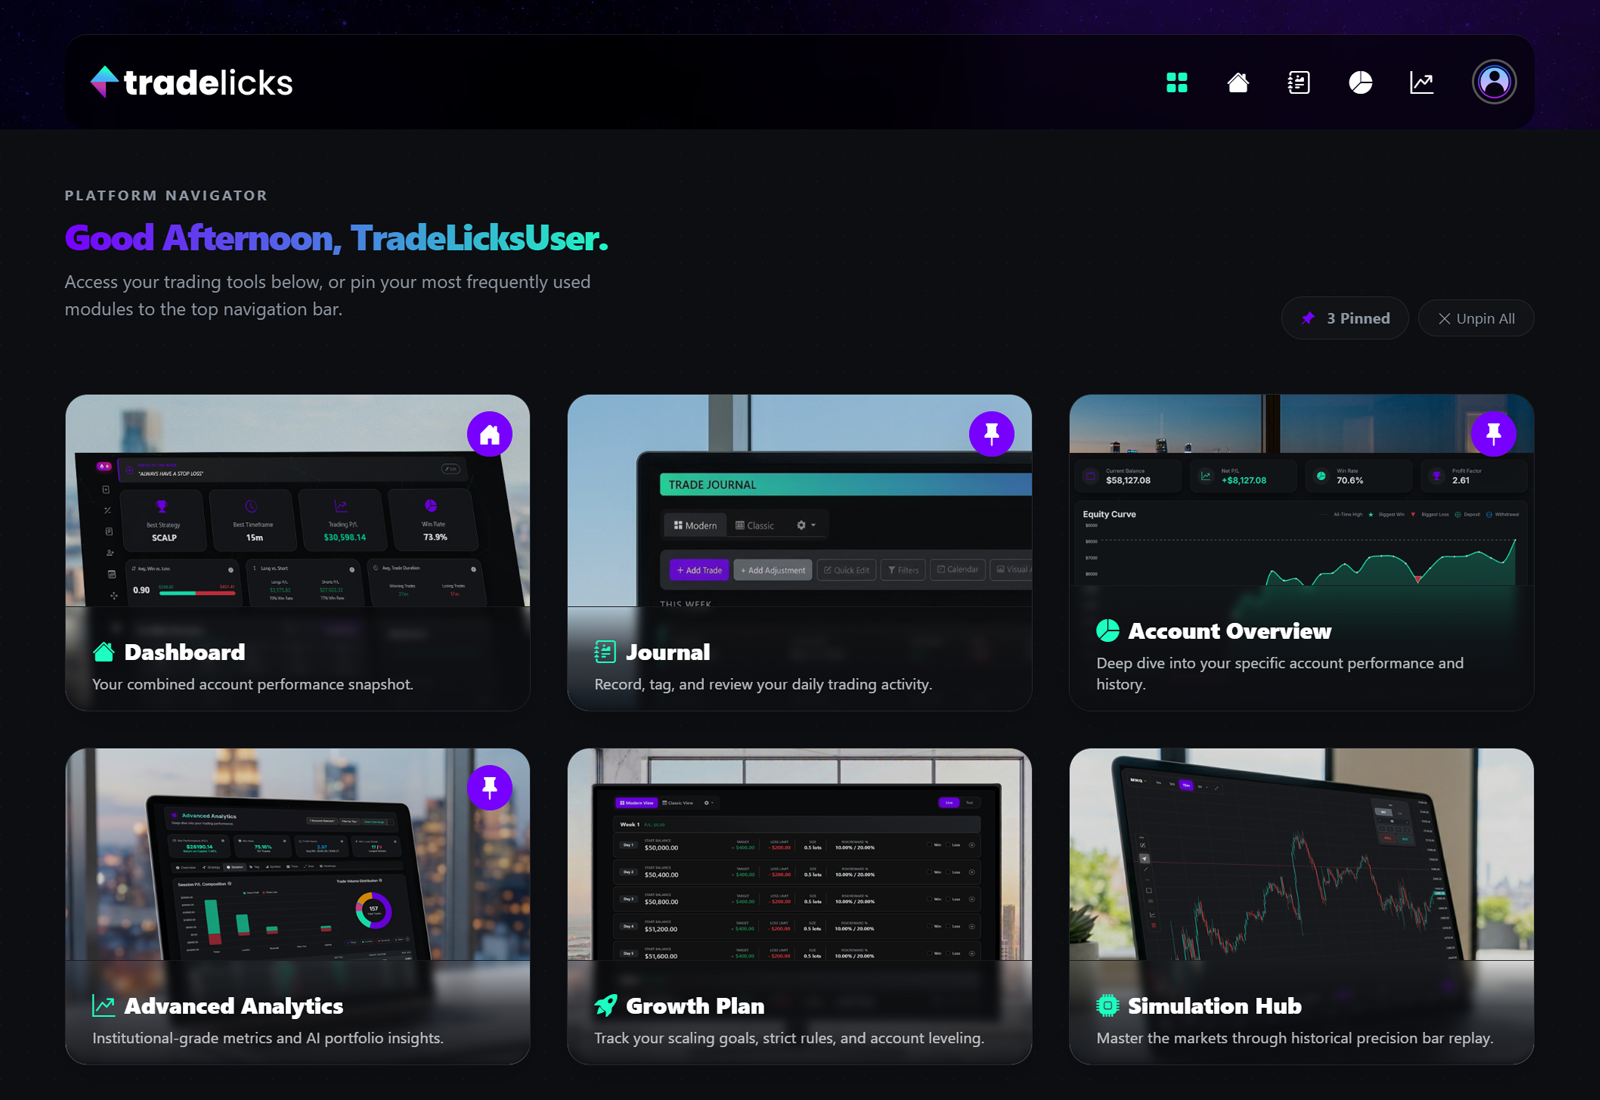
The new "Command Center" for your trading workflow.
A comprehensive, curated list of highly liquid instruments fully integrated into the platform.
We've massively expanded our automated importer to support the modern tools you actually use. Our CSV engine now intelligently detects and groups partial executions into single, clean journal entries.
March 7, 2026
We’ve pushed a few updates to the Journal to help streamline your workflow and provide better visibility when reviewing your trade history.
You can now toggle any journal view into a fullscreen mode. This provides a larger workspace for reviewing data, especially when using the Classic table view.
We've also added several refinements to ensure your navigation remains consistent:
These updates are live now for all users.
January 10, 2026
We've rolled out a massive update across the entire platform. From a sleek visual redesign to powerful new projection logic, we are giving you more control over your trajectory and making your daily workflow faster than ever.
The Growth Plan tool has been upgraded with realistic scaling strategies that benefit every type of trader.
We have streamlined the core journaling workflow to reduce clicks, clear visual noise, and help you focus on the data that matters.
These updates are designed to make your daily routine smoother and your long-term planning more accurate. Dive into the new Growth Plan settings to see the difference!
December 22, 2025
December 21, 2025
We're excited to announce three new Dashboard features designed to help you build consistency, stay focused, and control your data: Journaling Streaks, Focus of the Week, and the Review Stats Toggle!
Building a habit requires showing up every day. We've added a Journaling Streak counter to your home toolbar to track your consistency.
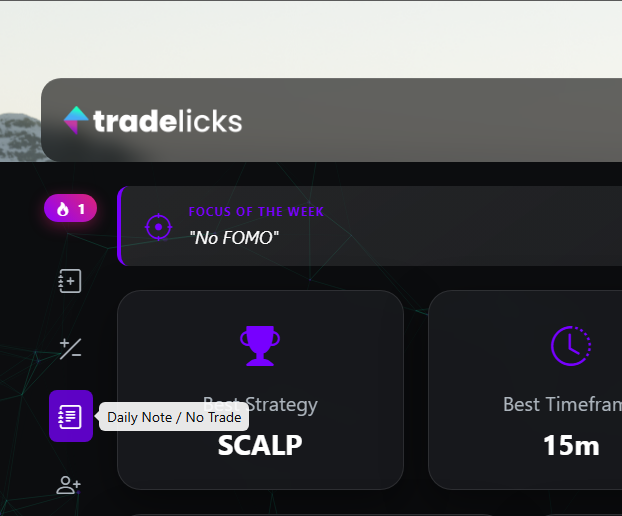
Consistency doesn't always mean trading; sometimes the best trade is the one you don't take. To make maintaining your streak easier, we've added a Quick Note / No Trade button () to the dashboard toolbar. Clicking this allows you to instantly log a "No Trade" day or a quick psychology note in seconds without navigating away. This counts as activity, keeping your streak alive even on days you stay on the sidelines.
Distractions are the enemy of execution. The new Focus of the Week widget allows you to pin a single, overriding goal or rule to the top of your dashboard.
Whether it's "No FOMO entries" or "Wait for the 15m close," your primary objective is now the first thing you see when you log in, keeping your mind primed for disciplined execution.
We know many of you trade a mix of Live accounts and Evaluation/Practice accounts. You now have full control over how your main dashboard calculates performance.
Found in the Dashboard Settings (gear icon), the new Include Review Stats toggle lets you decide if your dashboard totals should include all accounts or strictly your Live/Funded performance. Toggle it off for a pure view of your realized P/L, or on to see your total progress across the board.
Dive in and start building your streak today! We’re already hard at work on the next wave of features to help you master your edge, so watch this space—there is plenty more to come. Happy trading!
November 22, 2025
October 15, 2025
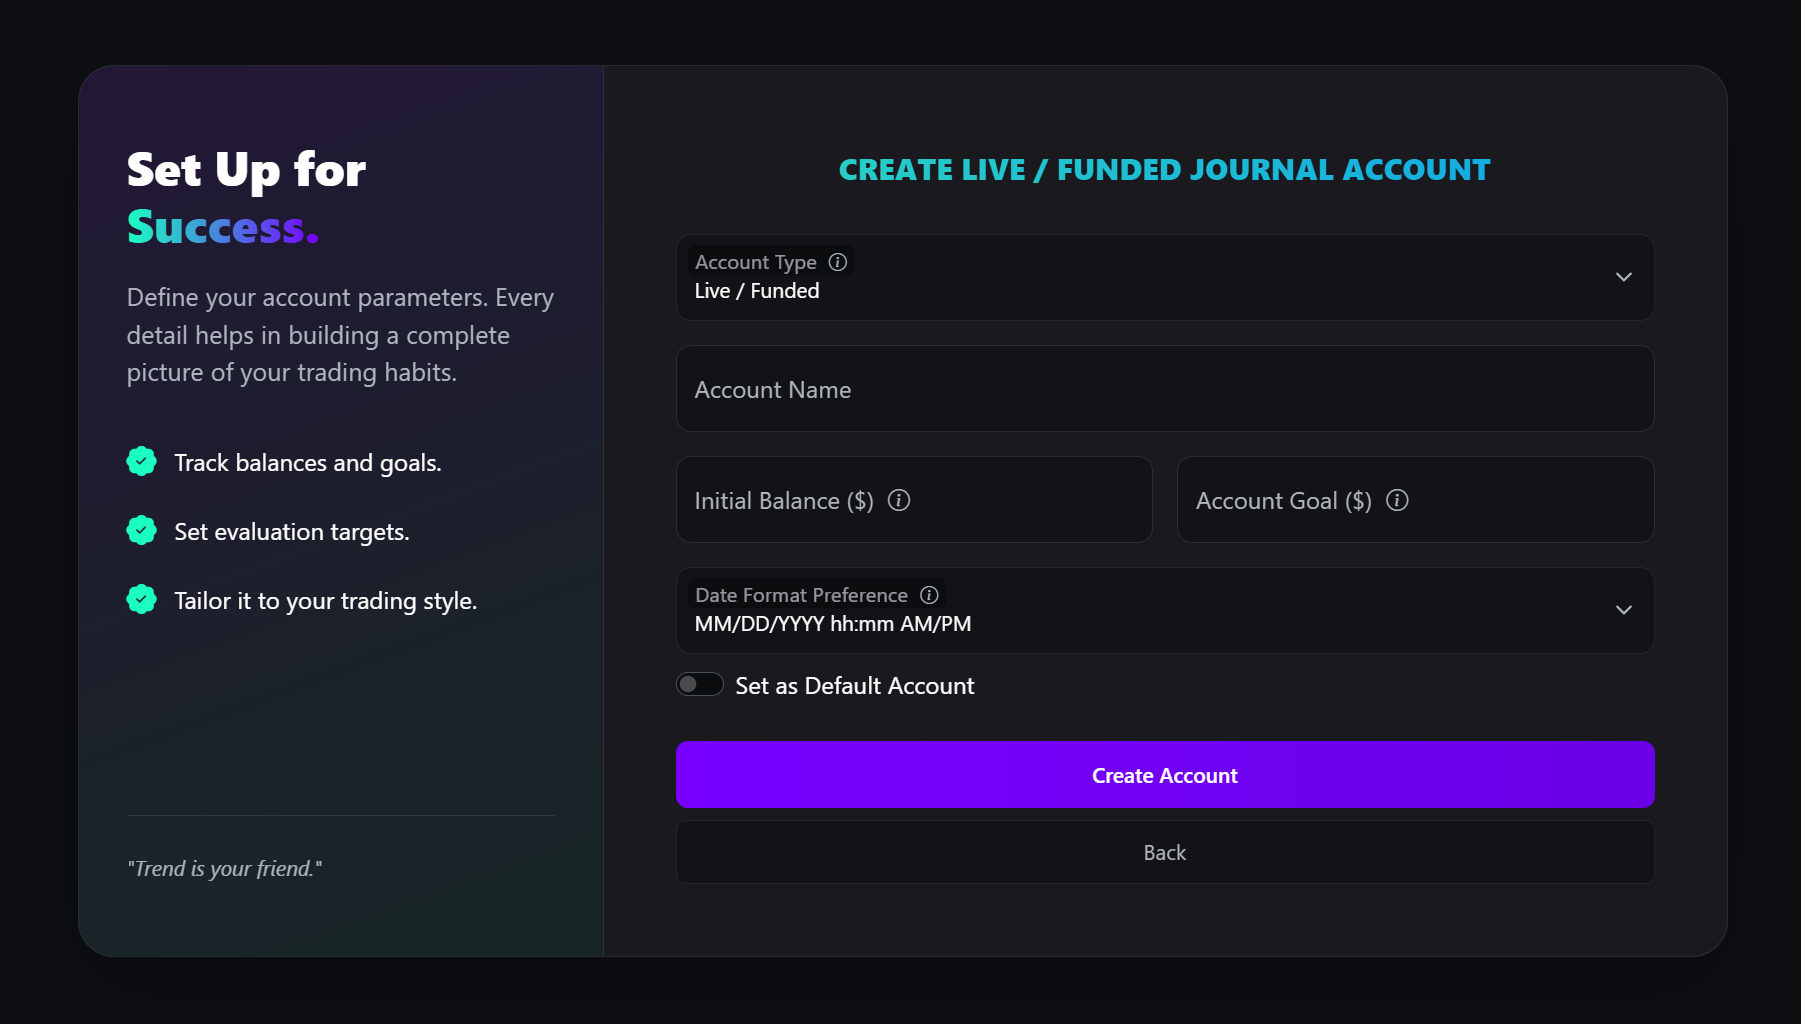
We're excited to announce two powerful new features designed to give you deeper insights and more control over your journal: the dedicated Account Overview page and the customizable Trading Day Start Time setting!
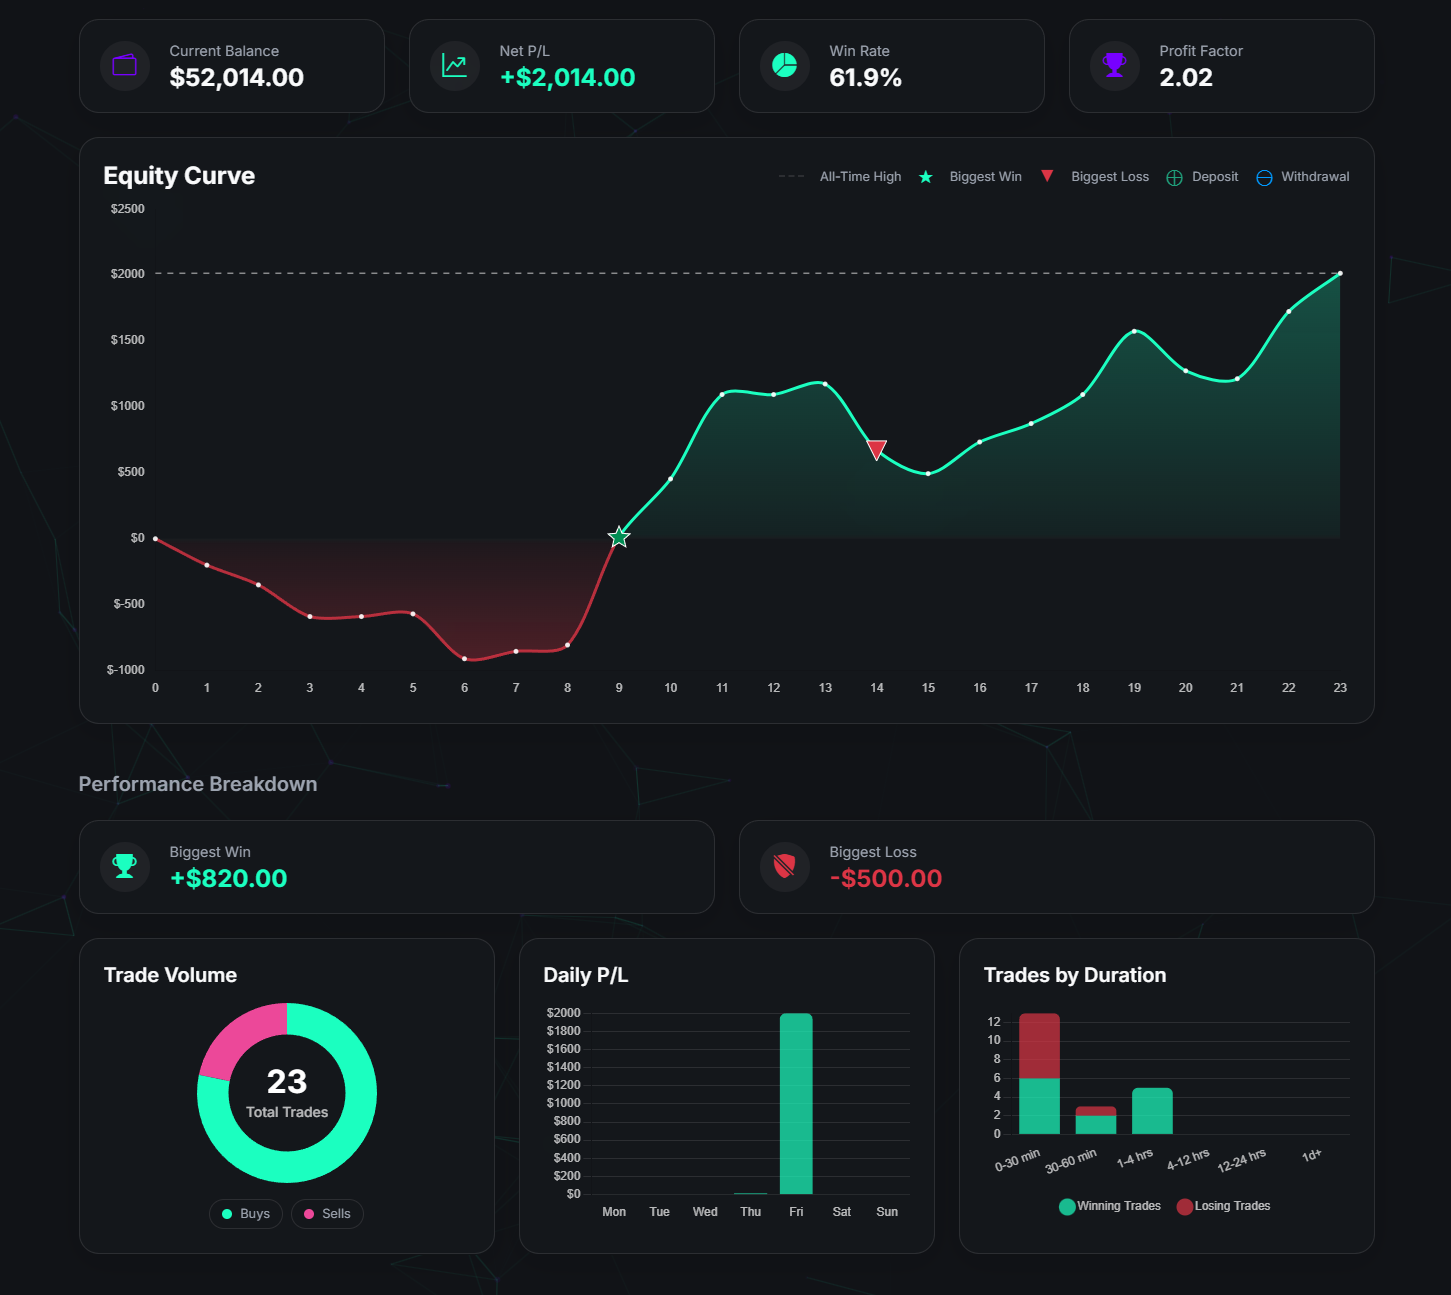
Ever wanted to analyze the performance of a single account in isolation? Now you can! The new Account Overview is a dedicated dashboard for each of your trading accounts, packed with detailed analytics that were previously only available in aggregate.
You can access this new dashboard by clicking on any of your account cards on the main Dashboard, or by clicking the Overview button at the top right of the Journal page when an account is selected.
This focused view includes:
For our Forex and Futures traders, we know that a "trading day" doesn't always end at midnight. This new setting solves that problem, ensuring your performance is grouped exactly how you trade.
Found in Session Management, this setting lets you define when your day officially begins. For example, if you set your start time to 10:00 AM, any trade closed before then (like at 3:00 AM Tuesday) will now correctly appear on Monday's calendar results, giving you a true picture of your session's performance.
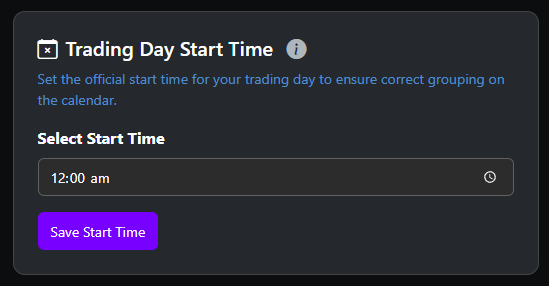
Learn more about how to use the Trading Day Start Time...
These updates are live now and are designed to provide more precision and power to your analysis. We're excited to see how you use them to refine your edge. Happy trading!
October 3, 2025
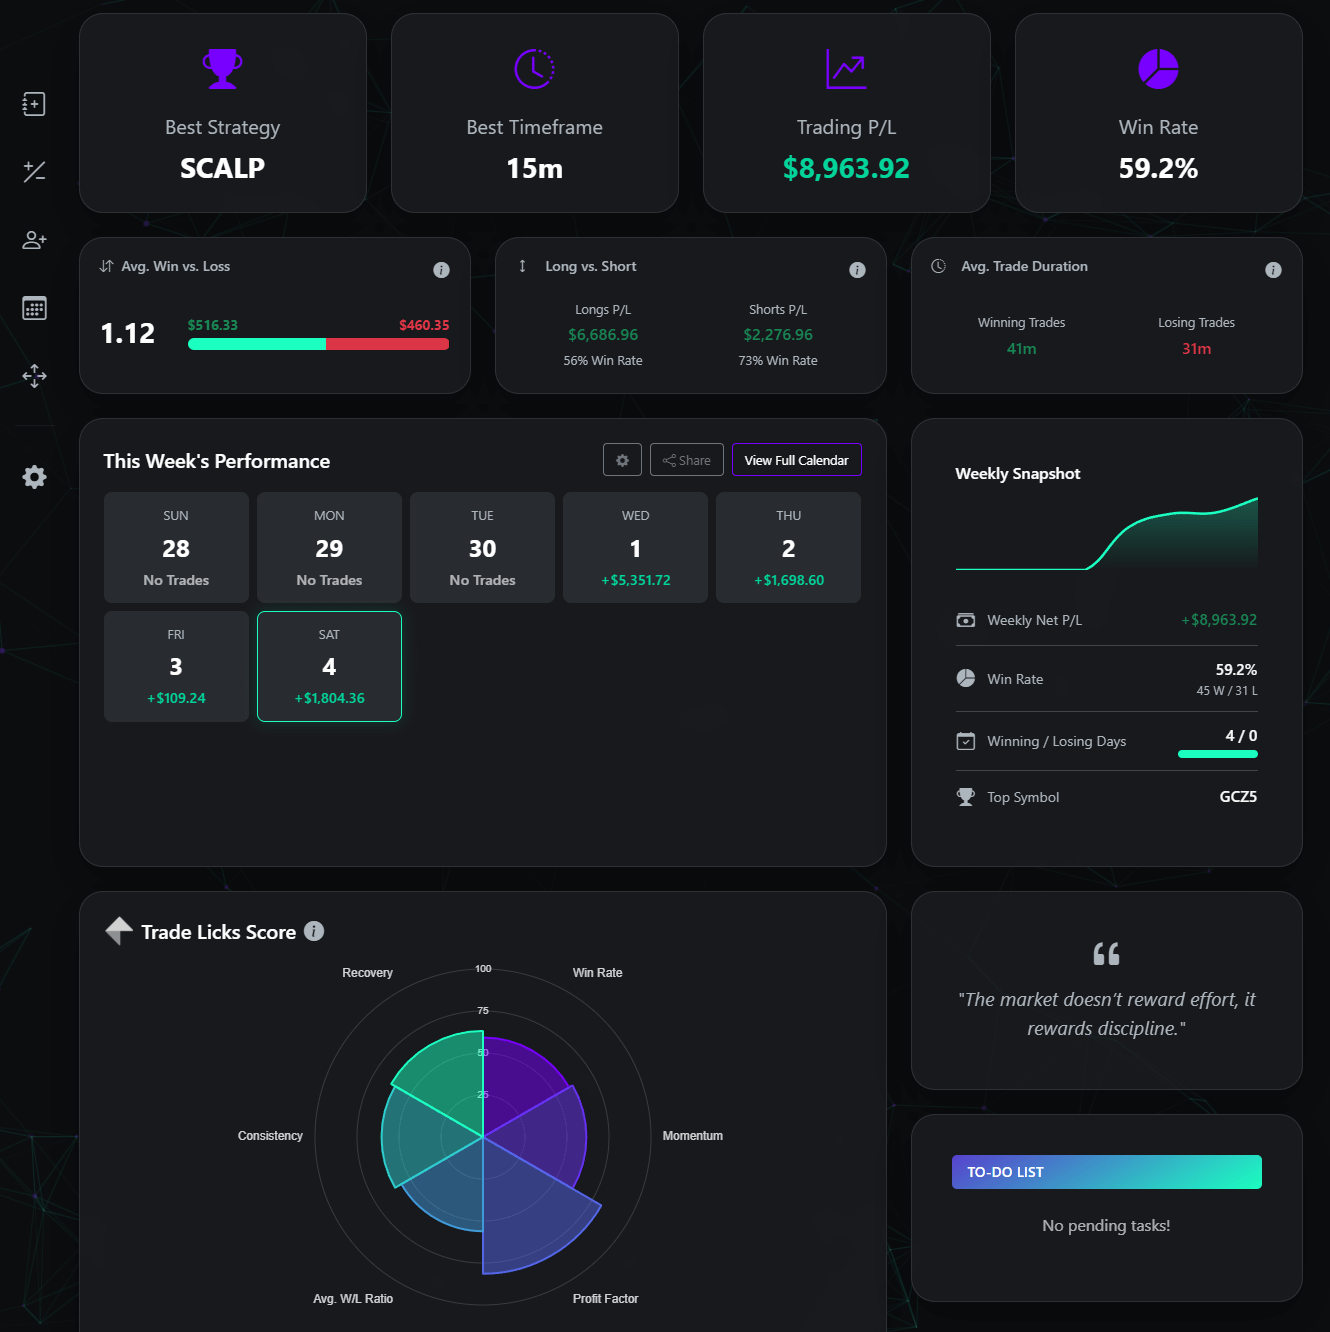
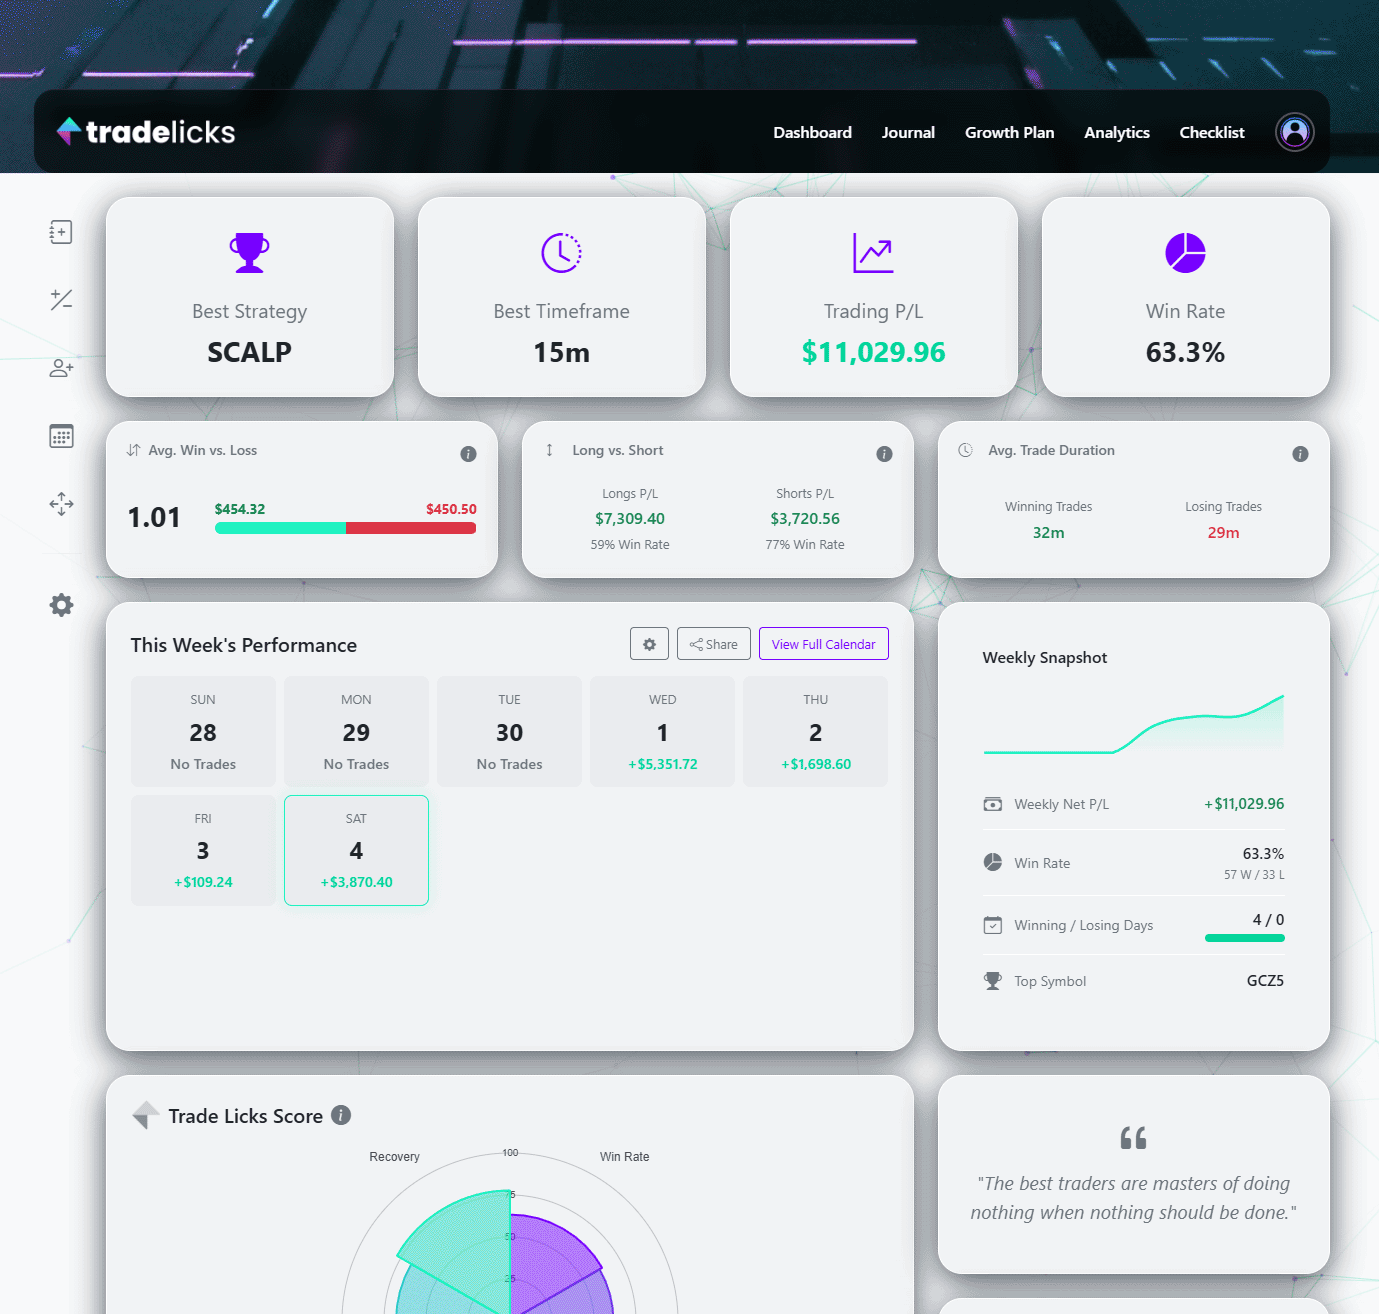
Today, we're thrilled to introduce a major dashboard upgrade featuring two brand-new components: the holistic Trade Licks Score and the immediate Weekly Snapshot!
The Trade Licks Score is more than just a chart; it's a dynamic visualization of your unique trading profile. Located prominently on your home dashboard, this new Polar Area chart distills your entire performance across six critical metrics into a single, easy-to-understand score. It helps you instantly identify areas of strength and opportunities for improvement.
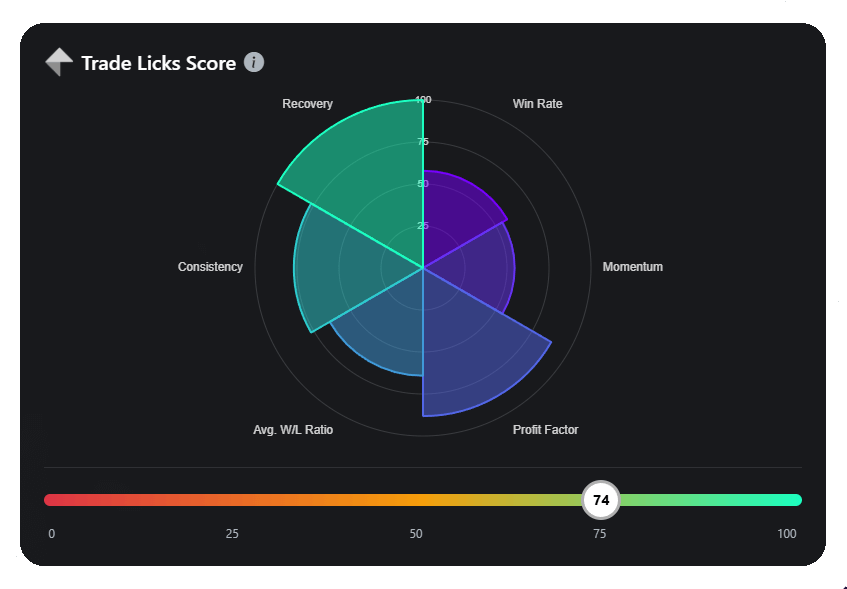
Your overall score is an average of your performance in these six key areas of trading:
Alongside the Trade Licks Score, you'll now find the Weekly Snapshot card. This new component is designed to give you an immediate, data-rich summary of your current week's trading activity, helping you stay on top of your performance as it happens.
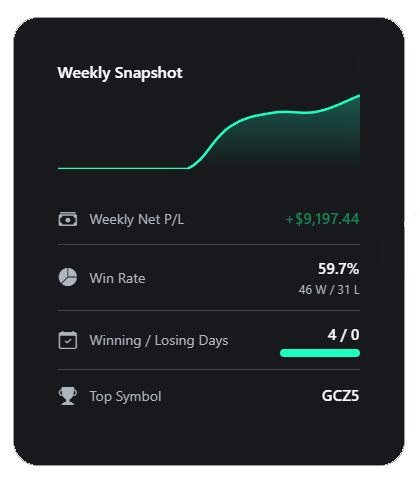
It's packed with key insights, including:
These powerful new additions are live on your dashboard right now. We built them for you, and we can't wait to see how these tools help you sharpen your skills and find your edge even faster. Happy trading!
September 22, 2025
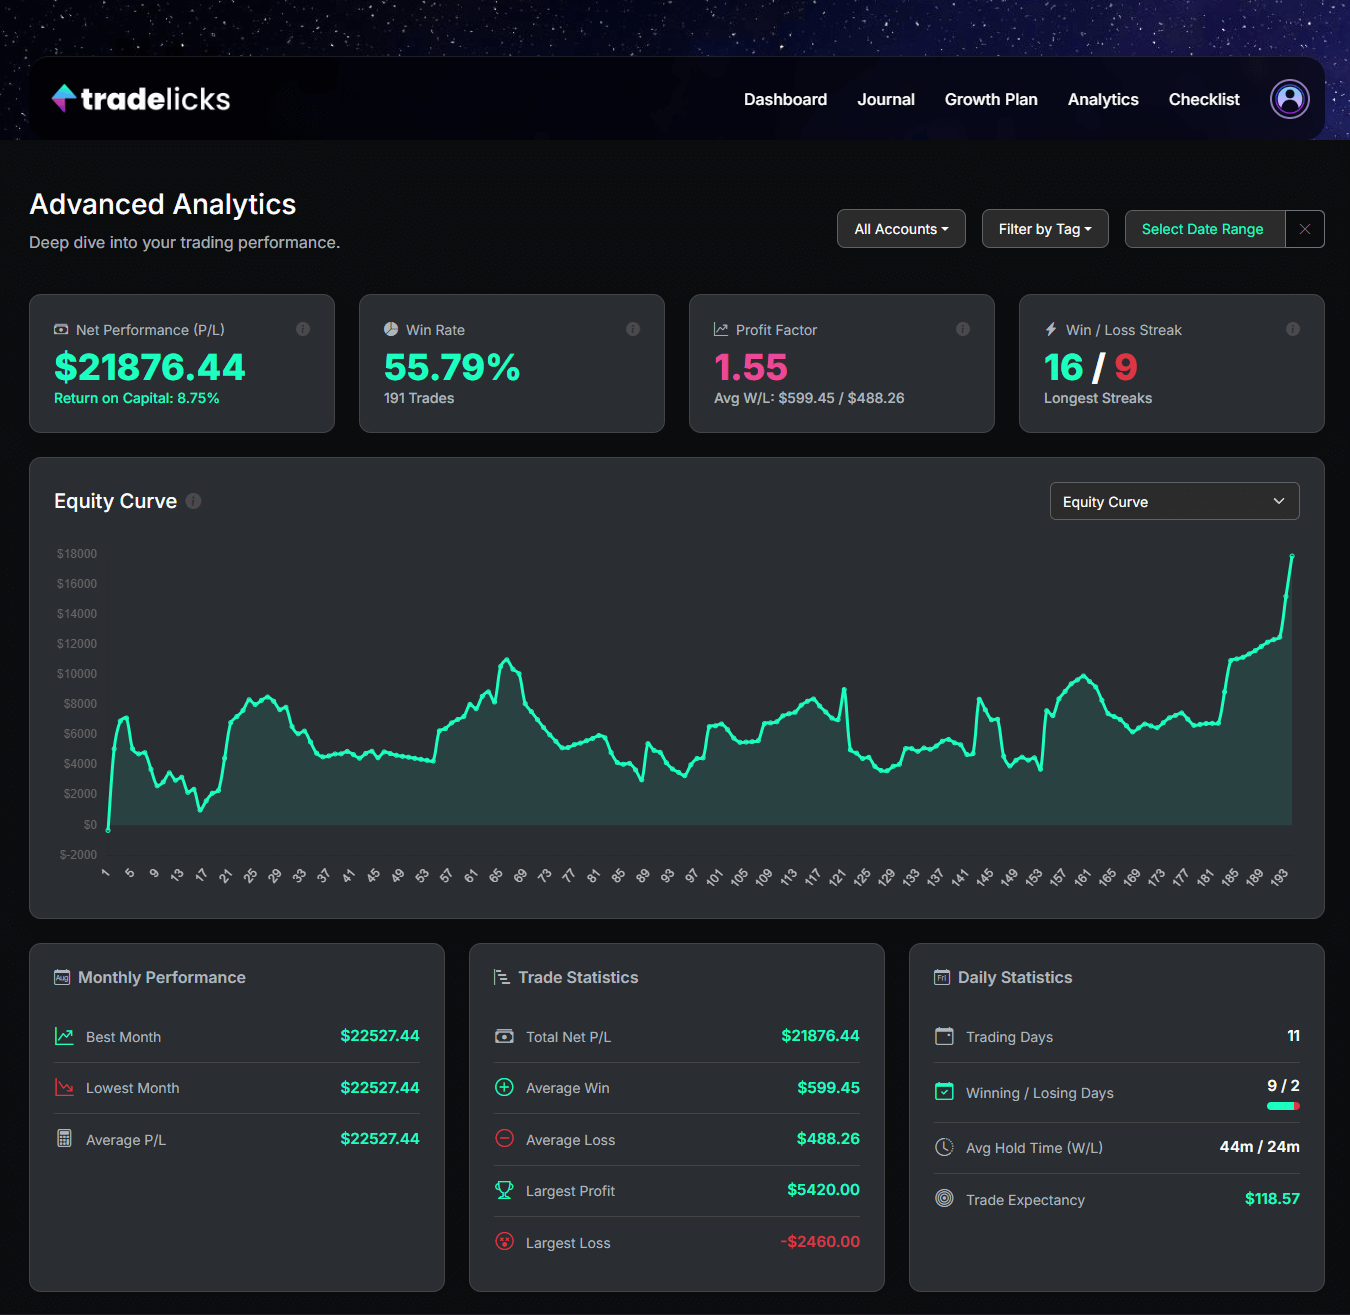
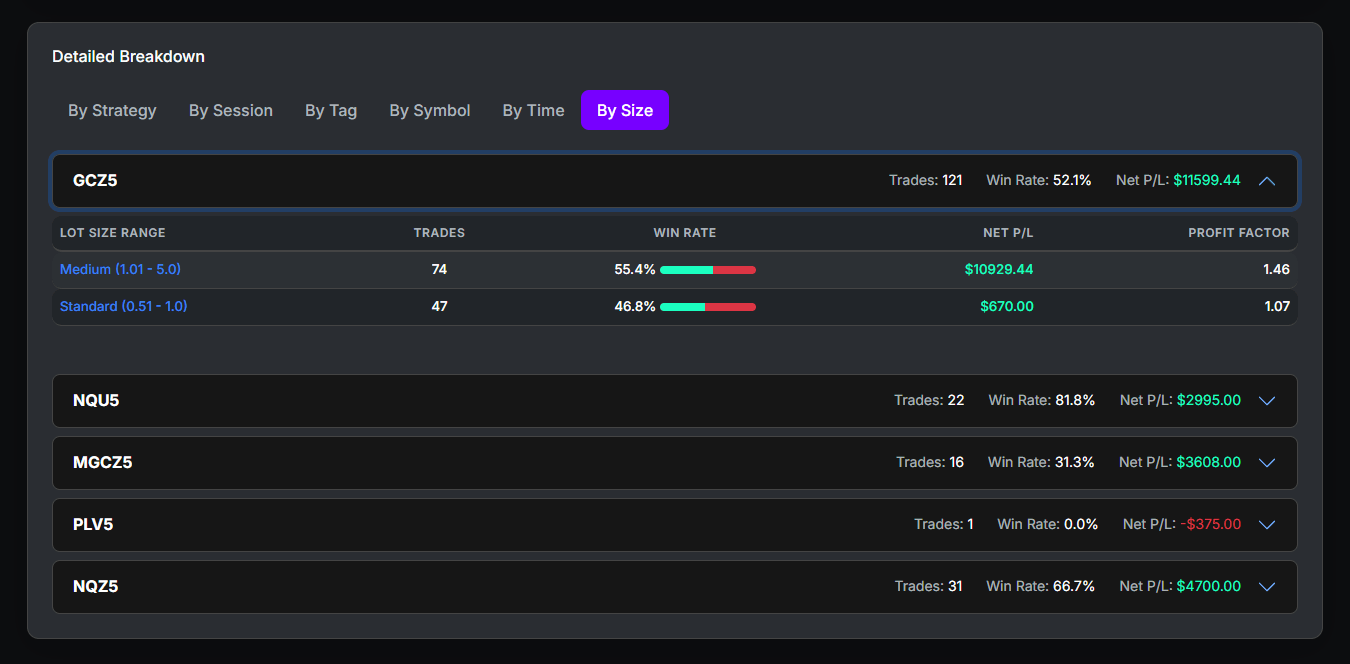
We're excited to announce a suite of powerful updates designed to make your trade analysis more insightful and your data entry more flexible. This release includes a major refinement of the Advanced Analytics page, direct Fee Tracking for trades, and our brand-new Generic CSV Importer!
We've refined the Advanced Analytics page to help you more quickly see what's working and what's not. The dashboard has been enhanced with new, powerful stats to give you an even deeper understanding of your performance.
Two major improvements have arrived to streamline how you log your trades.
Learn more about how to use the Generic CSV Importer...
These upgrades are all about giving you a clearer, faster, and more flexible journaling experience. We hope these tools help you find your edge and take your trading analysis to the next level!
September 20, 2025
We're excited to announce two major updates to help you connect with the community and share your trading journey more securely than ever before. First, we're officially on Instagram! And on the subject of sharing, we've launched a powerful new Privacy Mode for our Premium users.
You can now follow us for trading insights, platform tips, user spotlights, and more. We're building a community of disciplined traders, and we want you to be a part of it.
Follow @tradelicks on Instagram
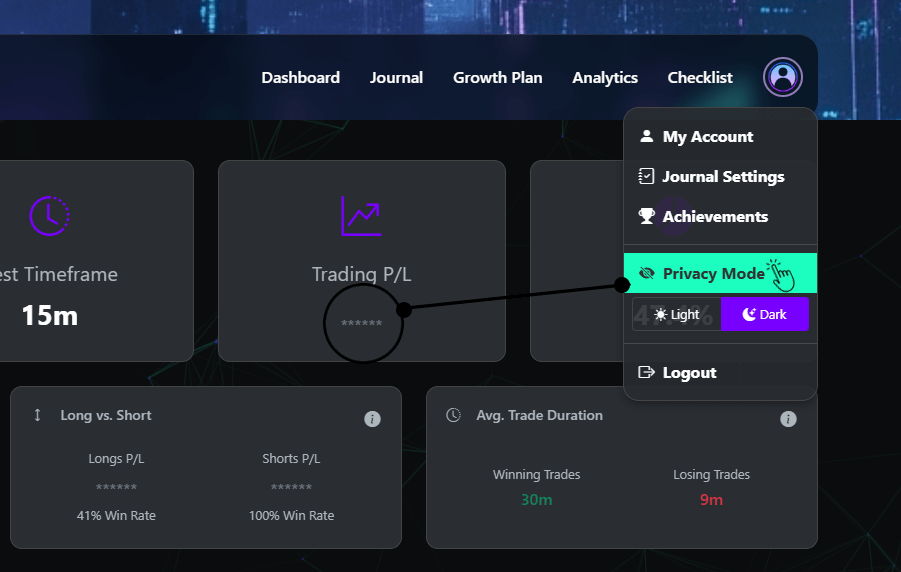
For traders who create content, stream live, or share their screens with mentors, showing sensitive account data can be a challenge. Our new Privacy Mode, an exclusive feature for Premium members, solves this problem.
Learn more about how to use Privacy Mode...
We're dedicated to building the tools you need to succeed. Follow our new Instagram for inspiration, and explore the new Privacy Mode to share your progress with peace of mind. Happy trading!
September 18, 2025
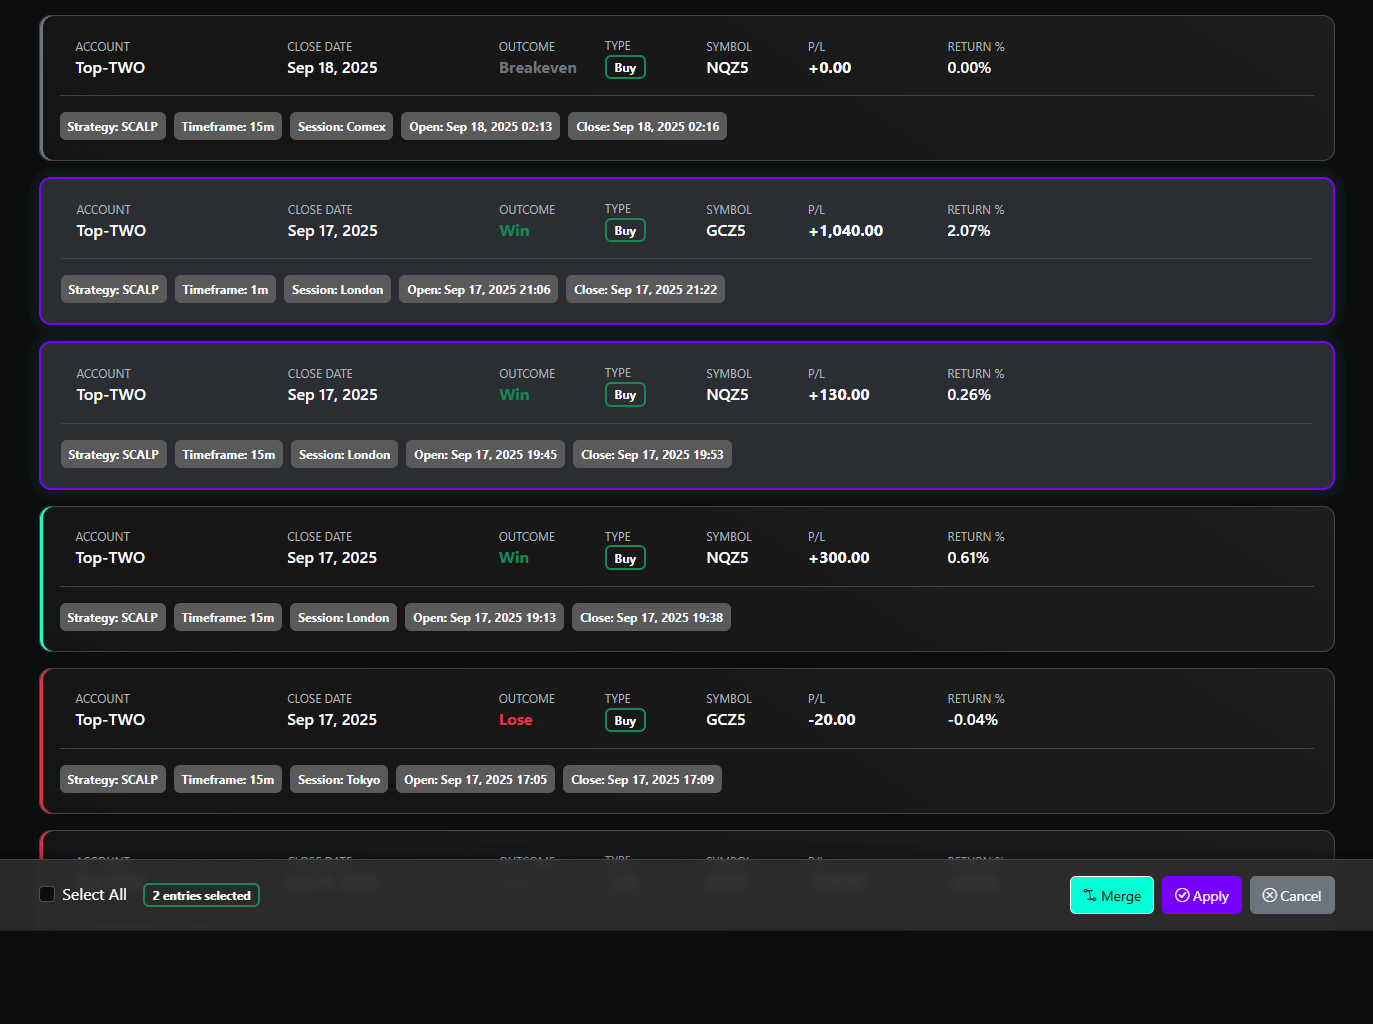
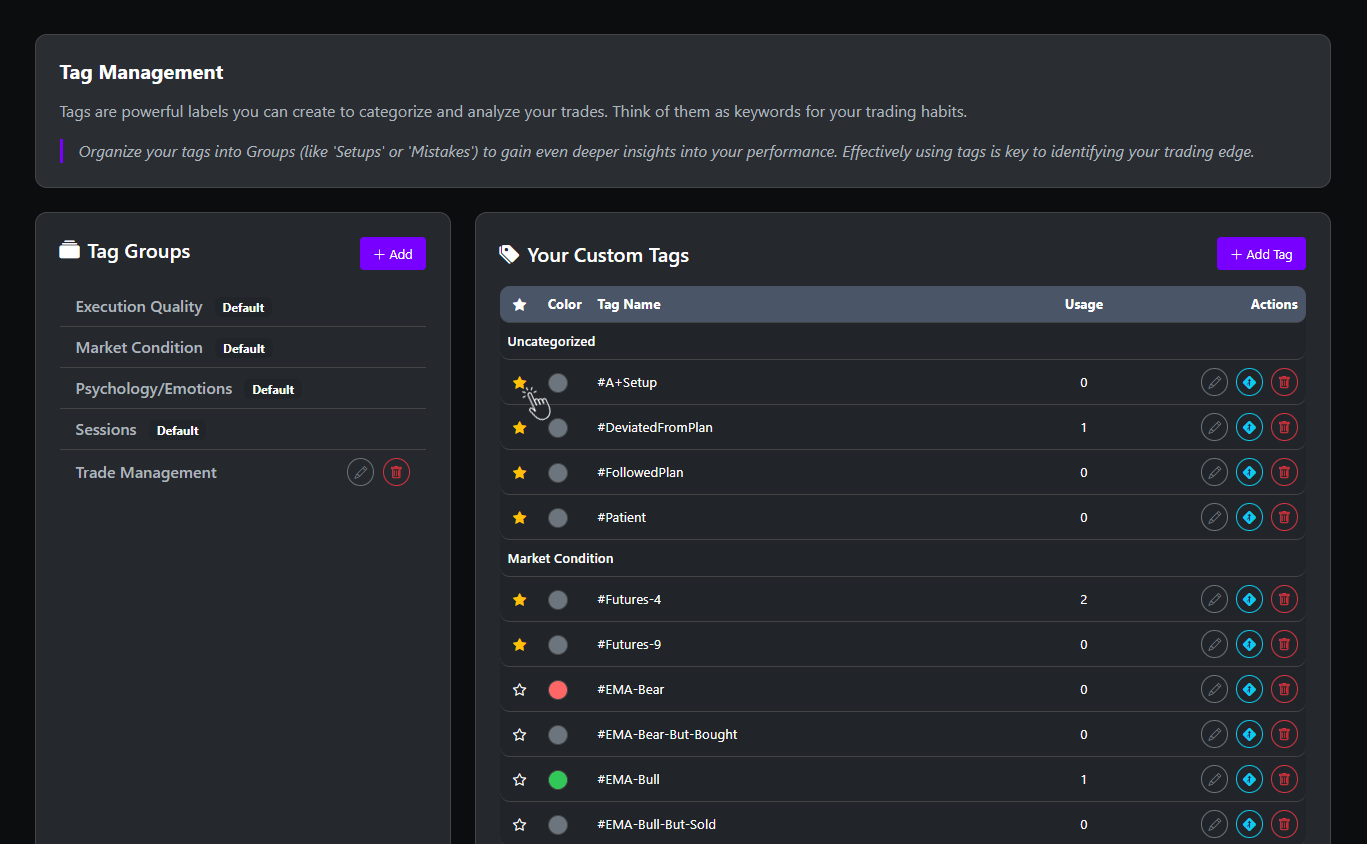
We're thrilled to introduce a powerful new tool designed to help you organize your journal and gain a clearer, more accurate view of your trading performance: Trade Merging. This feature is perfect for traders who scale in and out of positions or want to consolidate related entries into a single, comprehensive record.
Trade Merging allows you to select multiple trade entries and combine them into one. This is especially useful for:
Merging is simple and intuitive, designed to give you full control over the final result.
Learn more about how to use the Merge feature...
This new feature is designed to give you a more accurate and organized view of your trading history, especially for more complex trading styles. We can't wait for you to try it out!
September 14, 2025
We're excited to announce a major update, building upon our powerful journaling platform to bring you even more ways to connect your thoughts to your trades, supercharge your analysis, and streamline your workflow.
Your journal is more than just numbers; it's the story of your decisions. We've introduced powerful new ways to capture the "why" behind your trades and see it reflected directly in your performance data.
We've transformed the Advanced Analytics page from a static report into a dynamic research tool.
Learn more about using Drill-Downs...
We've also added two new features designed to streamline your journaling process and save you valuable time.
These new features are all about providing deeper connections between your actions, your thoughts, and your results. We're committed to continuously building upon the platform to give you the best tools to refine your edge. Dive in and explore!
September 11, 2025
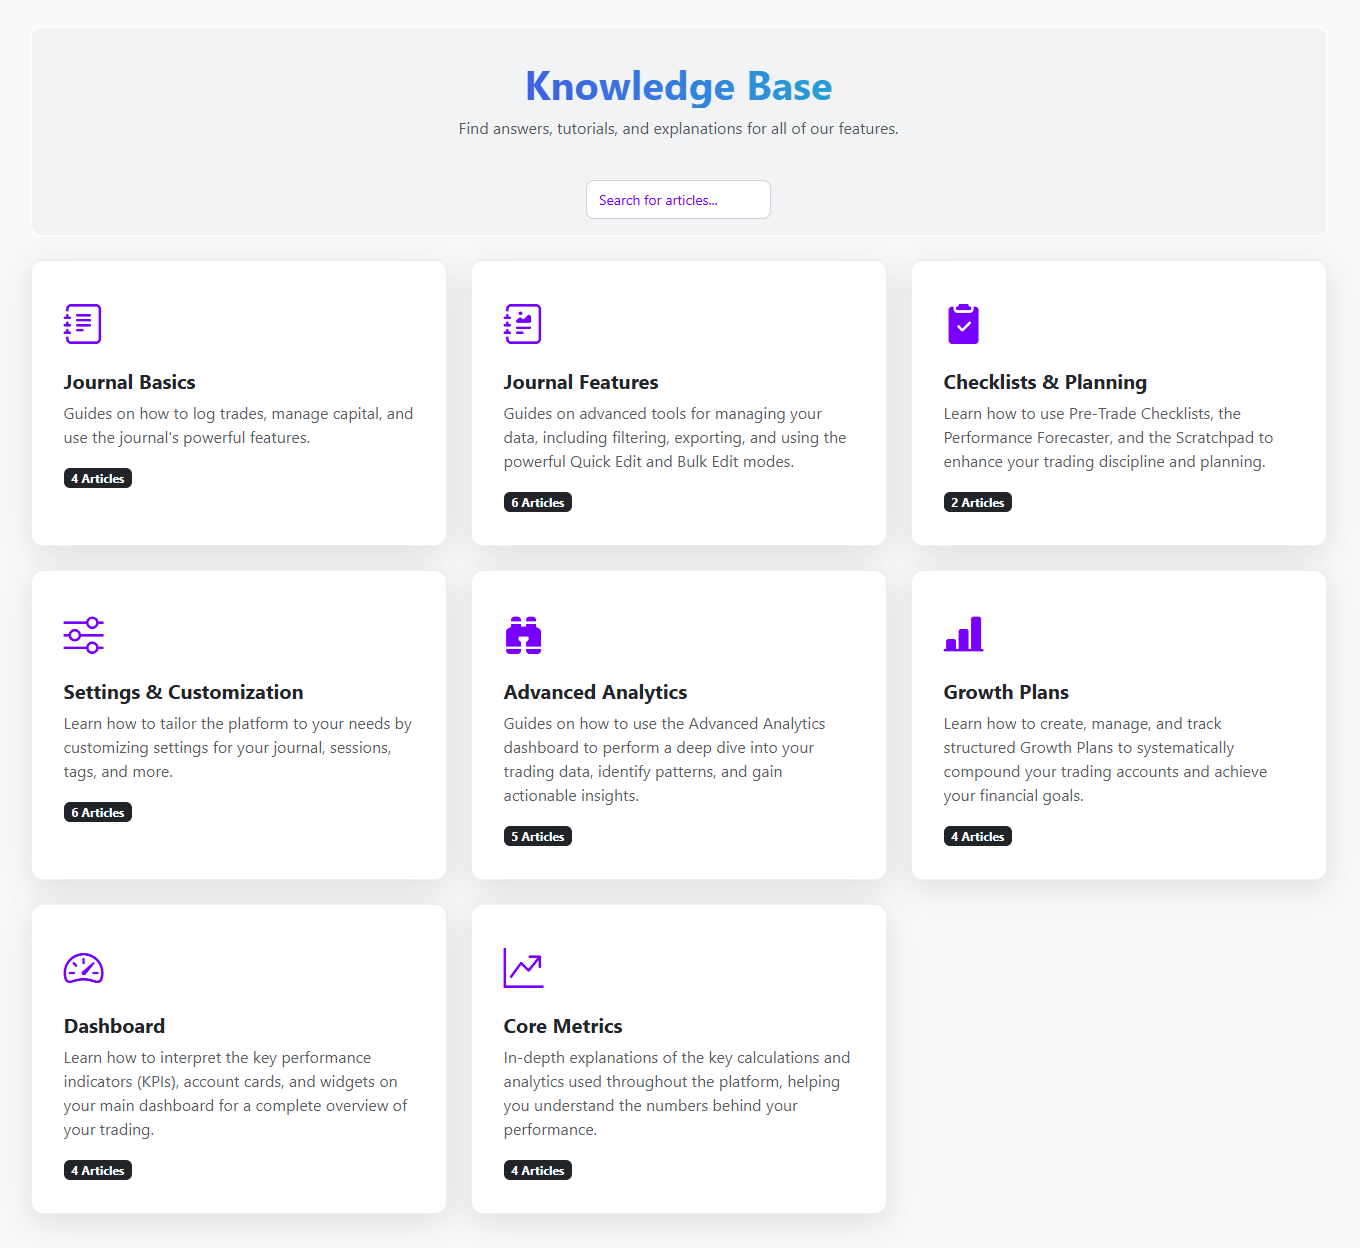
We are thrilled to announce the launch of the brand new Trade Licks Knowledge Base! This has been a massive undertaking to provide you with a comprehensive, centralized hub for clear, detailed guides on every feature our platform has to offer.
Our new help center is designed to be your first stop for any questions. You'll find step-by-step instructions, deep dives into core concepts, and helpful tips to accelerate your learning curve.
We've meticulously documented the entire platform, including our most powerful tools. Some of the new guides include:
The Knowledge Base is a living project. We will be constantly updating it with new articles and improving existing ones as we release new features. If there's something you'd like to see covered, don't hesitate to let us know!
Our goal is to empower you with the knowledge to use every part of Trade Licks to its full potential. Explore the new Knowledge Base today and take your journaling to the next level!
September 7, 2025
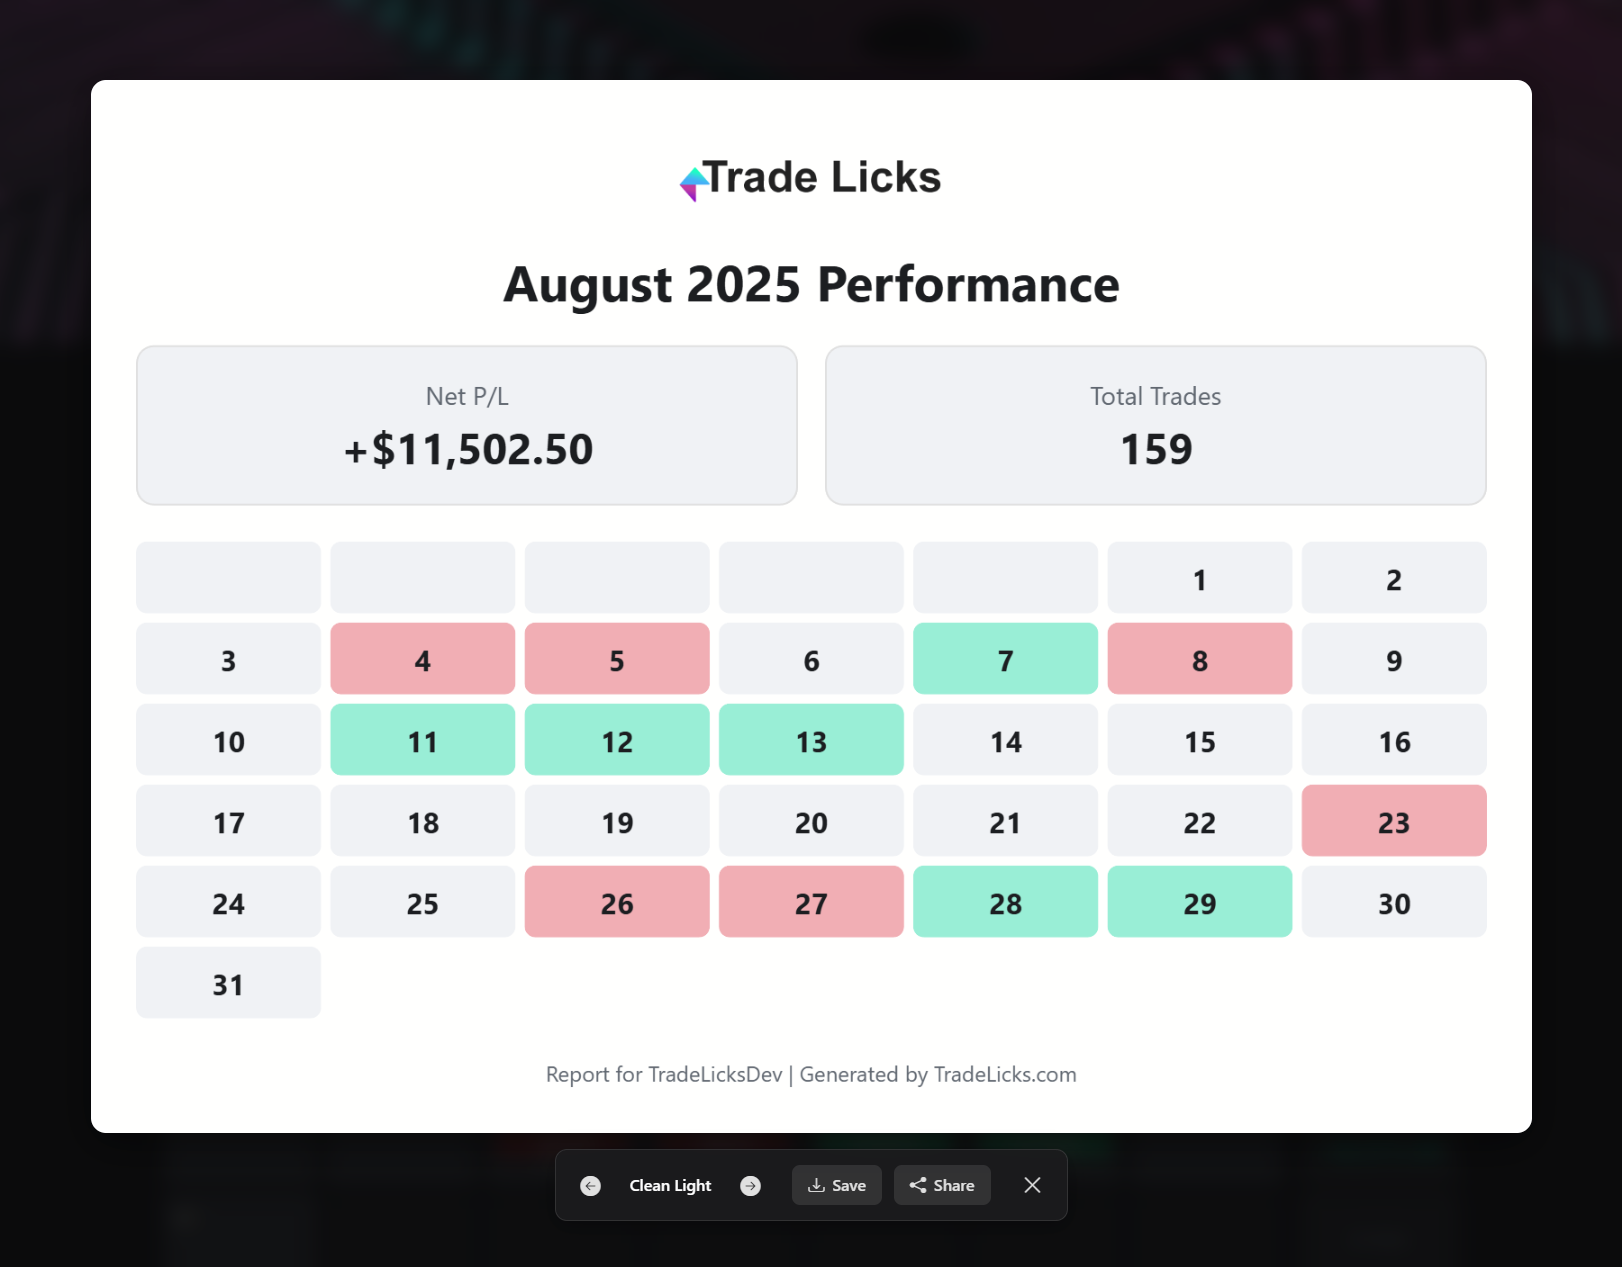
We're thrilled to roll out another update focused on giving you a clearer, more professional way to track and share your trading performance. This release introduces a completely revamped Performance Calendar and powerful upgrades to how you export your stats, helping you analyze your progress and celebrate your wins like never before.
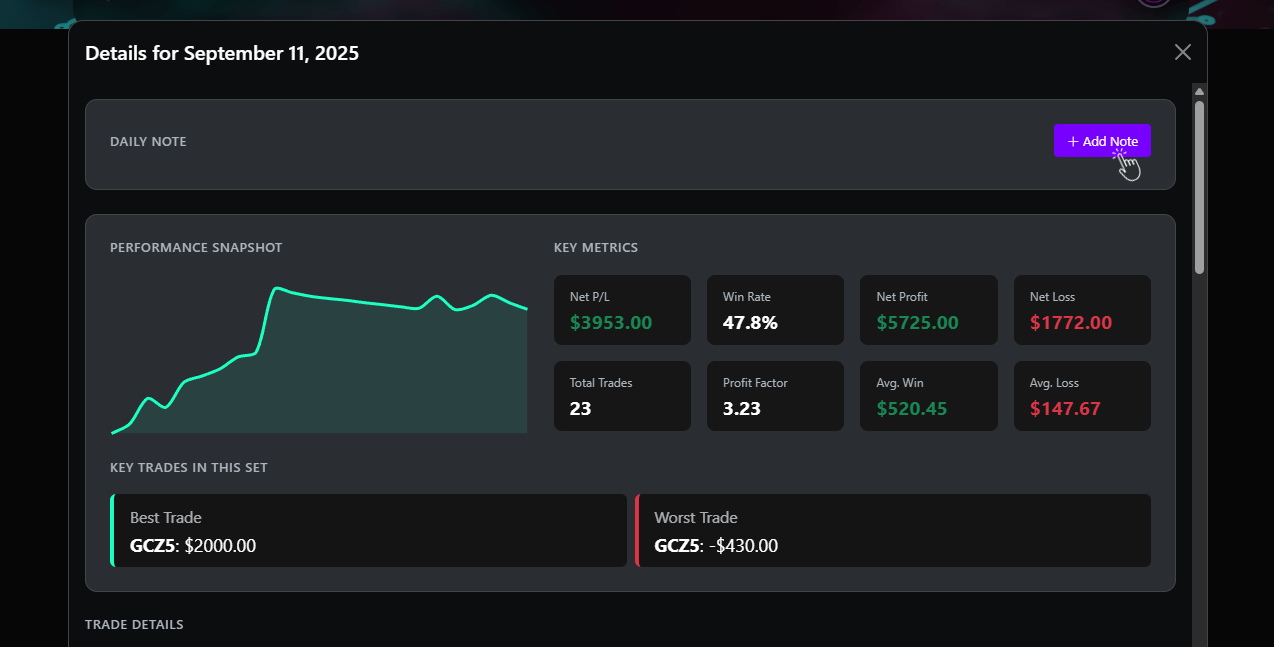
Your calendar is no longer just a log of trading days—it's now a powerful performance dashboard. We've redesigned it to give you an instant, data-rich overview of your consistency and profitability.
Pro Tip: Don't forget, you can click on any trading day in the calendar for an in-depth breakdown of the trades that contributed to that day's performance!

The ability to export your performance as a PNG isn't new, but we've completely rebuilt the experience. Instead of a direct save, you now have a powerful and flexible sharing interface with new options and locations.
These updates are designed to help you better understand your trading patterns and proudly share your journey. Jump into your account now to explore the new Calendar and try out the new sharing features!
August 31, 2025
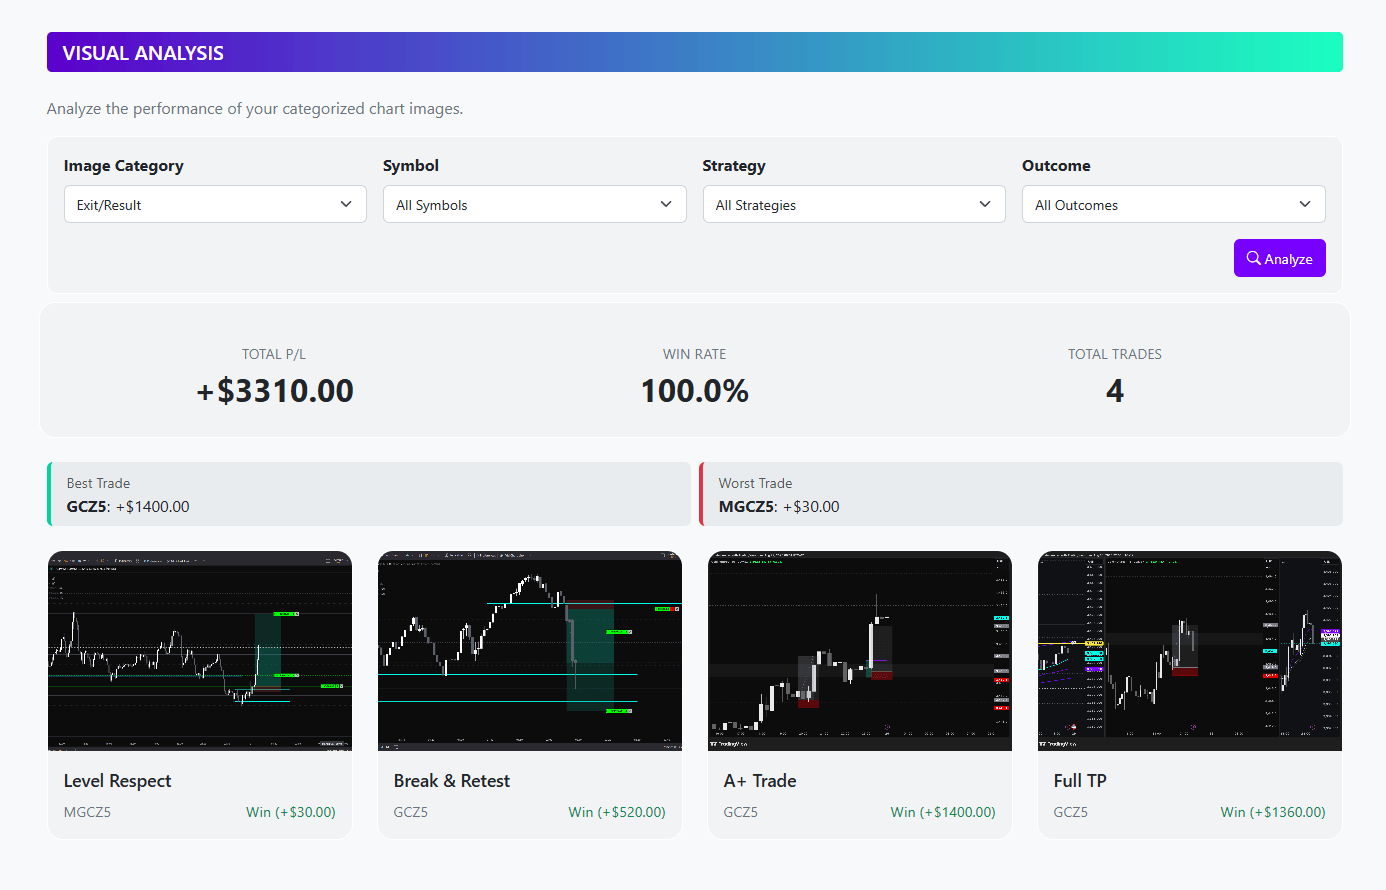
We're excited to announce a massive upgrade to the Trade Licks platform, built on one of your most requested features: multi-image uploads. This new foundation allows you to tell the complete visual story of every trade, and it powers an entirely new way to analyze your performance.
We've overhauled image handling to give you the flexibility and power to document every angle of your trading.
Uploading detailed images is just the beginning. We've built a brand-new Visual Analysis page to help you turn those images into actionable insights.
Note for Existing Users: To take full advantage of this new feature with your past trades, you'll need to edit any existing journal entries that have images attached. Simply open the entry, and you'll see a new option to assign a category (like "Pre-Trade Setup" or "Entry Trigger") to each image. This one-time update will allow the Visual Analysis engine to include your entire visual history in its calculations!
To guide you on your journey and reward good habits, we've more than doubled the number of achievements you can earn.
We're proud to bring you this major update, focused on providing professional-grade tools for visual review and performance analysis. You can find the new Visual Analysis page in the action bar on your Journal page, right next to the 'Calendar' button. Be sure to also check your Achievements page to see all the new goals and track your progress!
August 25, 2025
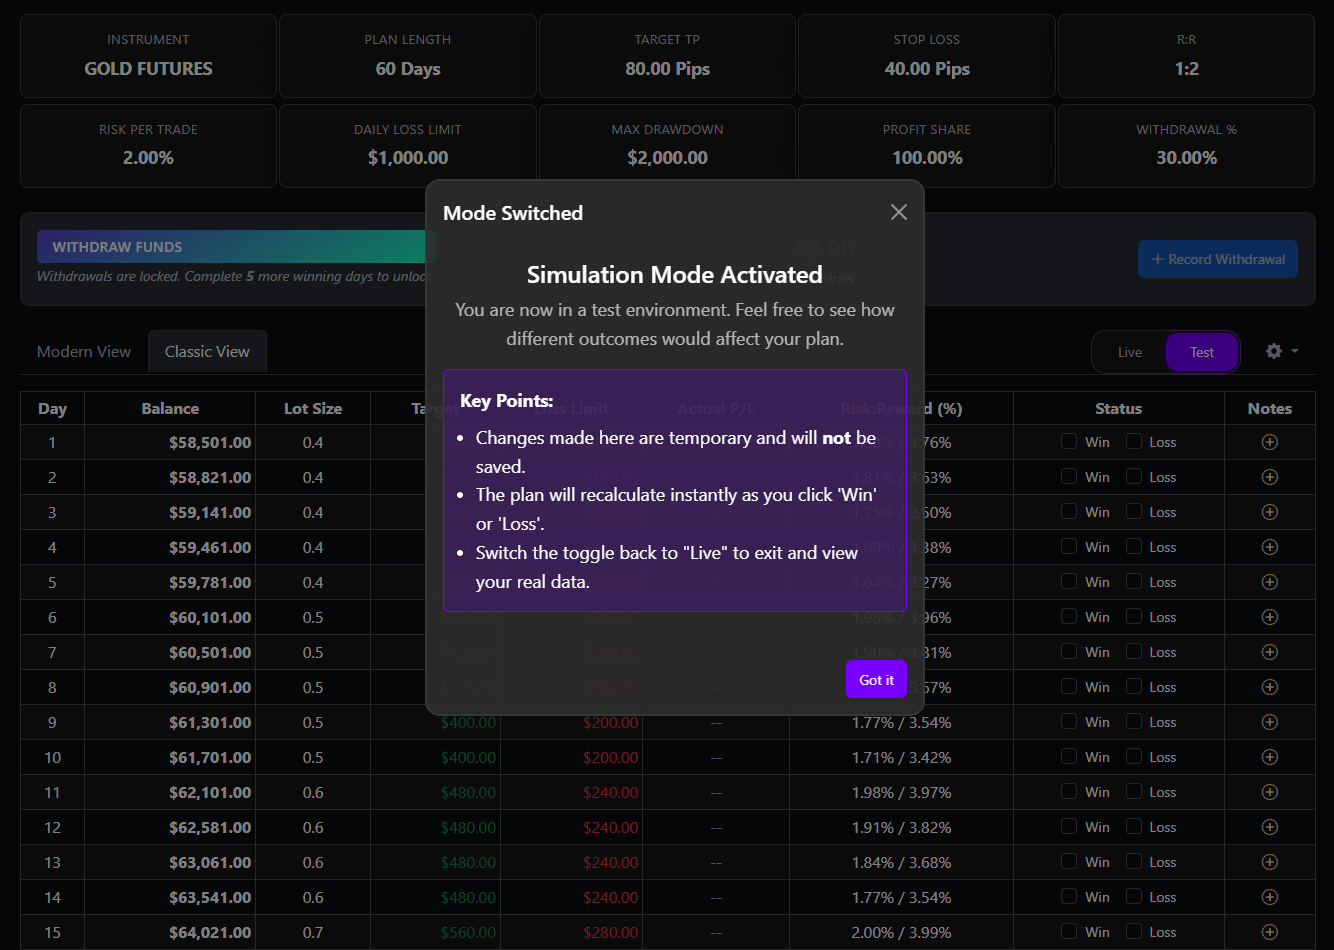
We've completely rebuilt the Growth Plan feature from the ground up. This major upgrade isn't just a facelift; it's a comprehensive overhaul designed to make this tool more powerful, accurate, and intuitive than ever before. Welcome to a smarter way to plan your success.
Ever wonder "what if?" Now you can find out. Test mode has been added, allowing you to plan for any scenario.
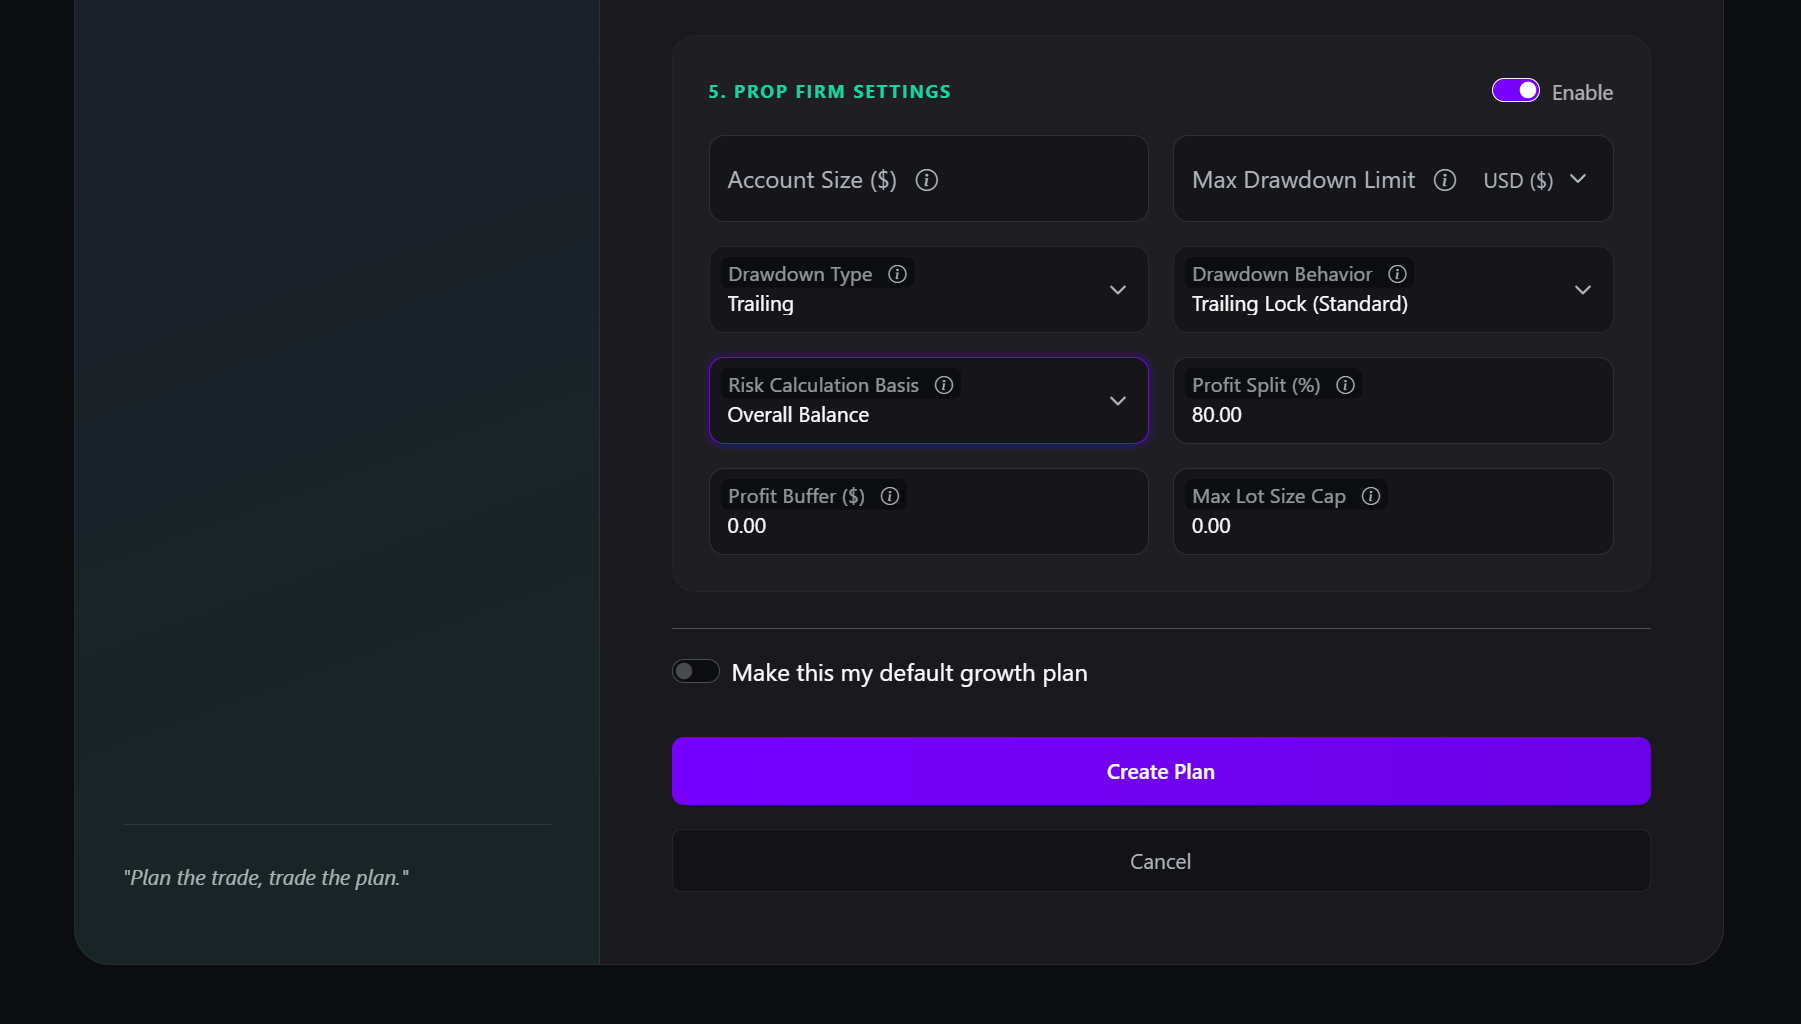
We've overhauled our prop firm logic to give you the precision required to pass your challenges and grow your accounts.
We've eliminated bugs and streamlined the experience based on a new, intelligent foundation.
This has been one of our biggest updates yet, driven entirely by our commitment to building the best tools for traders like you. Head over to your Growth Plan to experience the difference today!
August 20, 2025
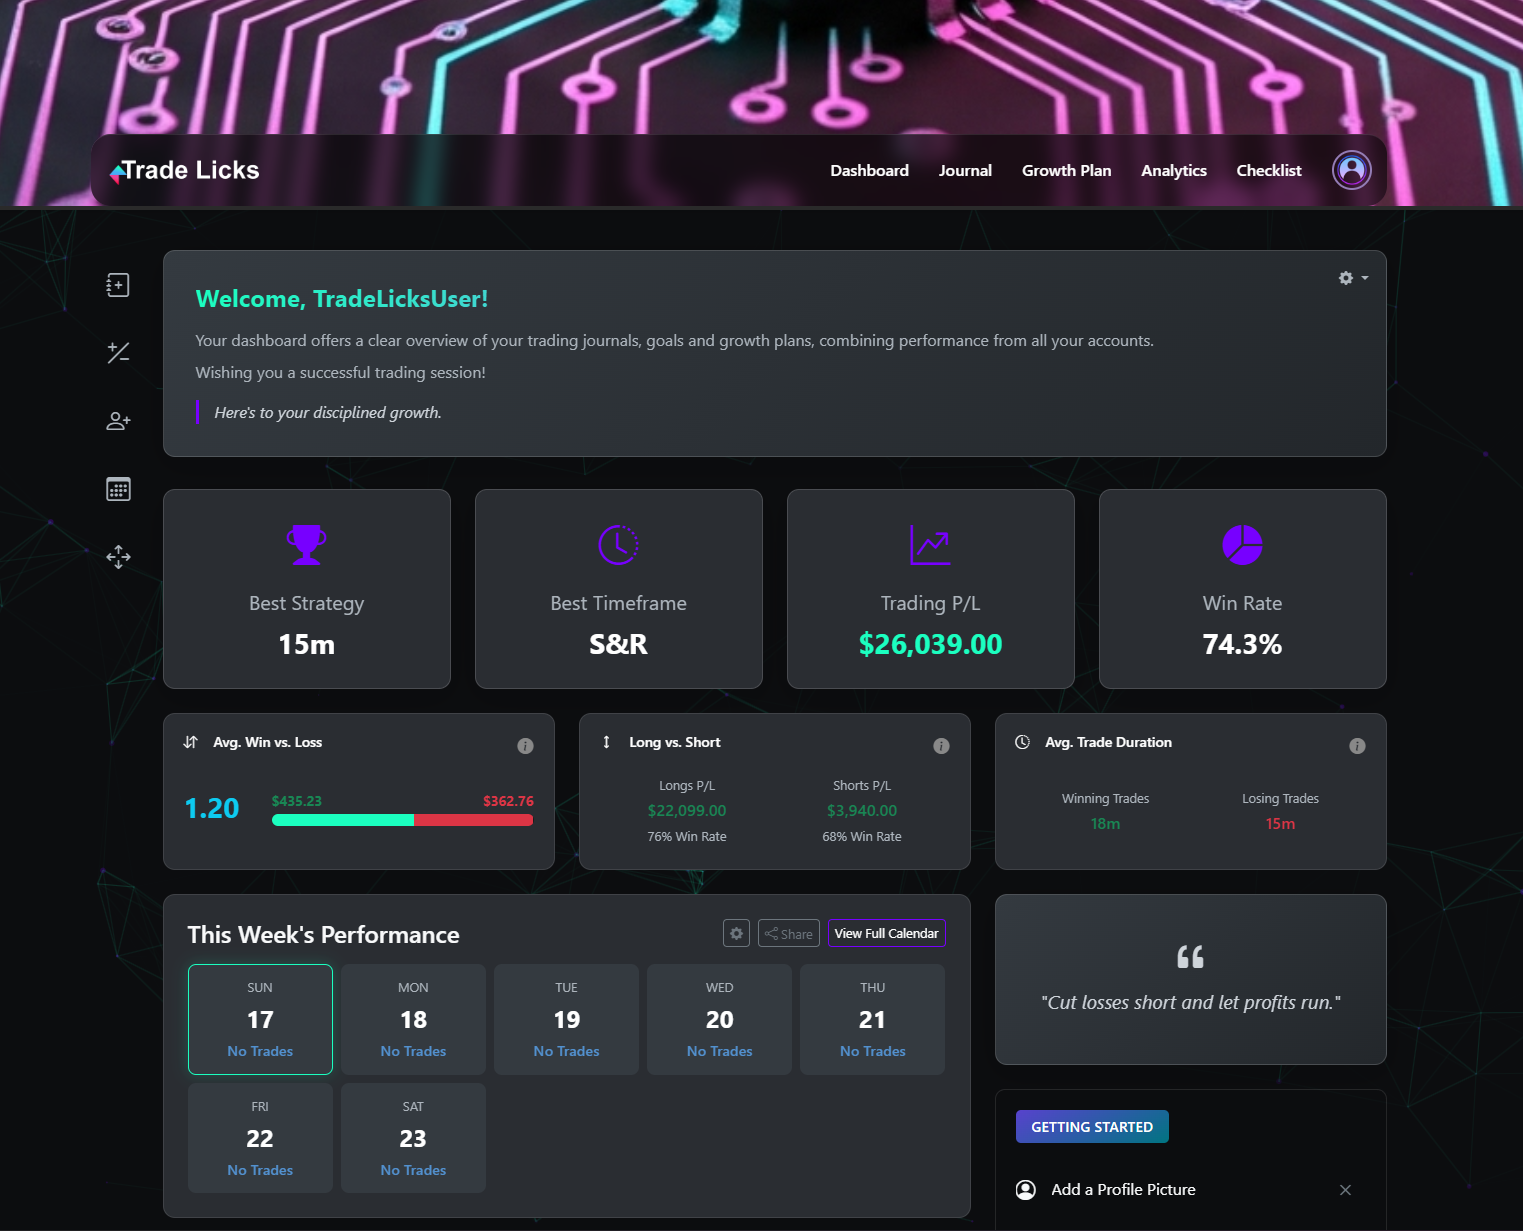
By popular request, we're excited to introduce a brand new Light Theme for the entire platform. Now you can analyze your trades in a bright, high-contrast interface designed for clarity in any lighting condition.
The new Light Theme offers a clean, modern aesthetic that makes your data easy to read, whether you're journaling in a bright office or on the go.
Switching themes is simple and can be done right from your profile menu.
We're thrilled to bring this update to you and believe it will make your journaling experience even better. Head to your profile menu to give it a try and see your trades in a new light!
August 16, 2025
We've just released two new features for your dashboard designed to make your journaling faster and more insightful. Meet the new Dashboard Toolbar and three Advanced Stat Cards.
The new toolbar is always visible on your dashboard, putting your most-used actions right at your fingertips. Here’s a look:
Alongside the new toolbar, we've added three advanced stat cards. They go beyond simple win rates to give you a more nuanced look at your trading habits.
These new features are designed to make your journaling experience more seamless and insightful. Head over to your main dashboard to see them in action. We're confident they will become a helpful part of your daily trading routine!
August 12, 2025
Understanding when you trade is key, but manually logging the session for every entry is tedious. To help you save time and unlock deeper insights, we're thrilled to launch our new Automatic Session & Overlap Detection System!
This intelligent system works in the background to bring effortless precision to your journaling. It automatically analyzes your trade's open time to log the correct session and apply insightful tags, saving you from tedious manual selection. Your journal now works smarter, so you can focus on trading better. Here’s what’s new:
This powerful new system is designed to transform your understanding of time-based performance. To get started, click your profile icon in the header and select Journal Settings. Dive in, explore the new features, and continue to master your edge!
August 4, 2025
We are thrilled to announce a massive platform upgrade, packed with powerful new features designed to give you unprecedented insight into your trading performance and streamline your workflow. From a comprehensive achievement system to advanced capital management, these tools are built to help you master your edge. Here’s what’s new:
This is one of our biggest updates yet, and it’s all designed to provide you with the professional-grade tools you need to analyze, improve, and succeed. Dive in, explore the new features, and continue to master your edge!
July 27, 2025
We've just rolled out a massive upgrade to your analytics and journaling experience, designed to give you an even greater edge in your trading. Here's what's new:
We're committed to building the most powerful trading journal on the market, and these updates are a direct result of that mission. Dive in, explore the new features, and continue to master your edge!